EpiInvert estimates time varying epidemic reproduction numbers and restored incidence curves by inverting a renewal equation through a variational model as described in PNAS, 2021 and Biology, 2022. EpiInvert also corrects the administrative weekly bias in the daily registration of cases and the bias introduced by the festive days. EpiInvert can manage daily incidence data and weekly aggregated incidence data. This version of the package also includes EpiInvertForecast, a learning method for the short time forecast of the restored incidence curve.
EpiInvert : A detailed description of EpiInvert R package functionalities.
Rt Comparison : A comparative analysis of the methods : EpiInvert, EpiEstim, Wallinga-Teunis and EpiNow2.
You can install the development version of EpiInvert from GitHub with:
 install.packages("devtools")
devtools::install_github("lalvarezmat/EpiInvert")We attach some required packages
library(EpiInvert)
library(ggplot2)
library(dplyr)
library(grid)
Loading data on COVID-19 daily incidence up to 2022-05-05 for France, Germany, the USA and the UK:
data(incidence)
tail(incidence)
#>           date   FRA    DEU    USA    UK
#> 828 2022-04-30 49482  11718  23349     0
#> 829 2022-05-01 36726   4032  16153     0
#> 830 2022-05-02  8737 113522  81644    32
#> 831 2022-05-03 67017 106631  61743 35518
#> 832 2022-05-04 47925  96167 114308 16924
#> 833 2022-05-05 44225  85073  72158 12460
Loading some festive days for the same countries:
data(festives)
head(festives)
#>          USA        DEU        FRA         UK
#> 1 2020-01-01 2020-01-01 2020-01-01 2020-01-01
#> 2 2020-01-20 2020-04-10 2020-04-10 2020-04-10
#> 3 2020-02-17 2020-04-13 2020-04-13 2020-04-13
#> 4 2020-05-25 2020-05-01 2020-05-01 2020-05-08
#> 5 2020-06-21 2020-05-21 2020-05-08 2020-05-25
#> 6 2020-07-03 2020-06-01 2020-05-21 2020-06-21
Executing EpiInvert using Germany data:
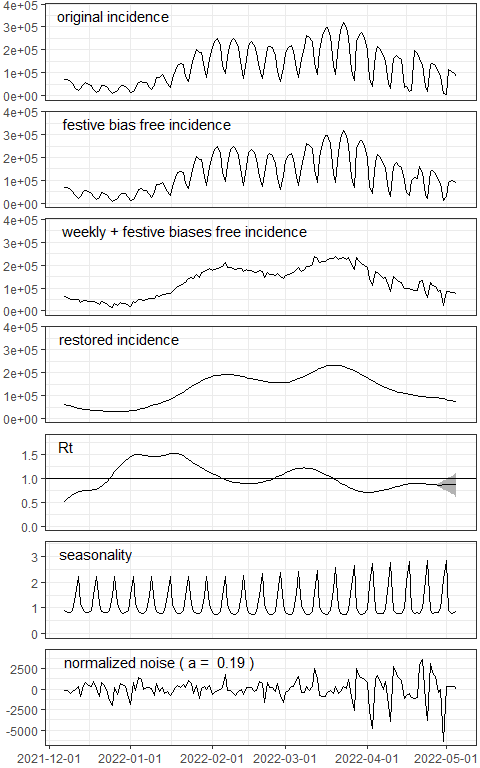
res <- EpiInvert(incidence$DEU,"2022-05-05",festives$DEU)Plotting the results:
EpiInvert_plot(res)
For a detailed description of EpiInvert outcomes see the EpiInvert vignette.