![]()
The FastJM package implement efficient computation of
semi-parametric joint model of longitudinal and competing risks
data.
The FastJM package comes with several simulated
datasets. To fit a joint model, we use jmcs function.
require(FastJM)
#> Loading required package: FastJM
#> Loading required package: MASS
#> Loading required package: statmod
data(ydata)
data(cdata)
fit <- jmcs(ydata = ydata, cdata = cdata,
            long.formula = response ~ time + gender + x1 + race,
            surv.formula = Surv(surv, failure_type) ~ x1 + gender + x2 + race,
            random =  ~ time| ID)
fit
#>
#> Call:
#>  jmcs(ydata = ydata, cdata = cdata, long.formula = response ~ time + gender + x1 + race, random = ~time | ID, surv.formula = Surv(surv, failure_type) ~ x1 + gender + x2 + race)
#>
#> Data Summary:
#> Number of observations: 3067
#> Number of groups: 1000
#>
#> Proportion of competing risks:
#> Risk 1 : 34.9 %
#> Risk 2 : 29.8 %
#>
#> Numerical intergration:
#> Method: pseudo-adaptive Guass-Hermite quadrature
#> Number of quadrature points:  6
#>
#> Model Type: joint modeling of longitudinal continuous and competing risks data
#>
#> Model summary:
#> Longitudinal process: linear mixed effects model
#> Event process: cause-specific Cox proportional hazard model with non-parametric baseline hazard
#>
#> Loglikelihood:  -8989.389
#>
#> Fixed effects in the longitudinal sub-model:  response ~ time + gender + x1 + race
#>
#>             Estimate      SE   Z value  p-val
#> (Intercept)  2.01853 0.05704  35.38803 0.0000
#> time         0.98292 0.03147  31.22885 0.0000
#> genderMale  -0.07766 0.05860  -1.32527 0.1851
#> x1          -1.47810 0.05851 -25.26356 0.0000
#> raceWhite    0.04527 0.05911   0.76581 0.4438
#>
#>         Estimate      SE  Z value  p-val
#> sigma^2  0.49182 0.01793 27.43751 0.0000
#>
#> Fixed effects in the survival sub-model:  Surv(surv, failure_type) ~ x1 + gender + x2 + race
#>
#>              Estimate      SE   Z value  p-val
#> x1_1          0.54672 0.18540   2.94892 0.0032
#> genderMale_1 -0.18781 0.11935  -1.57359 0.1156
#> x2_1         -1.10450 0.12731  -8.67602 0.0000
#> raceWhite_1  -0.10027 0.11802  -0.84960 0.3955
#> x1_2          0.62986 0.20064   3.13927 0.0017
#> genderMale_2  0.10834 0.13065   0.82926 0.4070
#> x2_2         -1.76738 0.15245 -11.59296 0.0000
#> raceWhite_2   0.03194 0.13049   0.24479 0.8066
#>
#> Association parameters:
#>               Estimate      SE Z value  p-val
#> (Intercept)_1  0.93973 0.12160 7.72809 0.0000
#> time_1         0.31691 0.19318 1.64051 0.1009
#> (Intercept)_2  0.96486 0.13646 7.07090 0.0000
#> time_2         0.03772 0.24137 0.15629 0.8758
#>
#>
#> Random effects:
#>   Formula: ~time | ID
#>                  Estimate      SE  Z value  p-val
#> (Intercept)       0.52981 0.03933 13.47048 0.0000
#> time              0.25885 0.02262 11.44217 0.0000
#> (Intercept):time -0.02765 0.02529 -1.09330 0.2743
The FastJM package can make dynamic prediction given the
longitudinal history information. Below is a toy example for competing
risks data. Conditional cumulative incidence probabilities for each
failure will be presented.
ND <- ydata[ydata$ID %in% c(419, 218), ]
ID <- unique(ND$ID)
NDc <- cdata[cdata$ID %in% ID, ]
survfit <- survfitjmcs(fit,
ynewdata = ND,
cnewdata = NDc,
u = seq(3, 4.5, by = 0.3),
M = 50,
seed = 100)
#> | | | 0% | |= | 2% | |=== | 4% | |==== | 6% | |====== | 8% | |======= | 10% | |========= | 12% | |========== | 14% | |=========== | 16% | |============= | 18% | |============== | 20% | |================ | 22% | |================= | 24% | |=================== | 27% | |==================== | 29% | |===================== | 31% | |======================= | 33% | |======================== | 35% | |========================== | 37% | |=========================== | 39% | |============================= | 41% | |============================== | 43% | |=============================== | 45% | |================================= | 47% | |================================== | 49% | |==================================== | 51% | |===================================== | 53% | |======================================= | 55% | |======================================== | 57% | |========================================= | 59% | |=========================================== | 61% | |============================================ | 63% | |============================================== | 65% | |=============================================== | 67% | |================================================= | 69% | |================================================== | 71% | |=================================================== | 73% | |===================================================== | 76% | |====================================================== | 78% | |======================================================== | 80% | |========================================================= | 82% | |=========================================================== | 84% | |============================================================ | 86% | |============================================================= | 88% | |=============================================================== | 90% | |================================================================ | 92% | |================================================================== | 94% | |=================================================================== | 96% | |===================================================================== | 98% | |======================================================================| 100%
survfit
#>
#> Prediction of Conditional Probabilities of Event
#> based on 50 Monte Carlo samples
#>
#> $`218`
#> $`218`$`Cumulative incidence probabilities for type 1 failure`
#> times Mean Median 95%HDLower 95%HDUpper
#> 1 2.441634 0.00000000 0.00000000 0.00000000 0.0000000
#> 2 3.000000 0.09409995 0.08439099 0.02680045 0.2505176
#> 3 3.300000 0.13096812 0.12189837 0.04061000 0.3148925
#> 4 3.600000 0.18169006 0.18341437 0.05473491 0.4257421
#> 5 3.900000 0.22059759 0.21583291 0.07014845 0.5123262
#> 6 4.200000 0.25554959 0.24445482 0.08128623 0.5671258
#> 7 4.500000 0.27644079 0.26324625 0.09083009 0.6027723
#>
#> $`218`$`Cumulative incidence probabilities for type 2 failure`
#> times Mean Median 95%HDLower 95%HDUpper
#> 1 2.441634 0.0000000 0.0000000 0.00000000 0.0000000
#> 2 3.000000 0.1188501 0.1040518 0.02608558 0.3853528
#> 3 3.300000 0.1748083 0.1497234 0.04007024 0.5540829
#> 4 3.600000 0.1994586 0.1749631 0.04563150 0.6148572
#> 5 3.900000 0.2364823 0.2127958 0.05561986 0.6712990
#> 6 4.200000 0.2665352 0.2506279 0.06341423 0.7084854
#> 7 4.500000 0.3038783 0.2869893 0.07048539 0.7581722
#>
#>
#> $`419`
#> $`419`$`Cumulative incidence probabilities for type 1 failure`
#> times Mean Median 95%HDLower 95%HDUpper
#> 1 2.432155 0.00000000 0.00000000 0.000000000 0.00000000
#> 2 3.000000 0.03253085 0.03069550 0.008767364 0.07148498
#> 3 3.300000 0.04748489 0.04426280 0.015251152 0.10394147
#> 4 3.600000 0.06941185 0.06670128 0.023630057 0.14636707
#> 5 3.900000 0.08820968 0.08998766 0.029119034 0.17407396
#> 6 4.200000 0.10667737 0.10464168 0.035382172 0.20011320
#> 7 4.500000 0.11903075 0.11171259 0.039342101 0.21482290
#>
#> $`419`$`Cumulative incidence probabilities for type 2 failure`
#> times Mean Median 95%HDLower 95%HDUpper
#> 1 2.432155 0.00000000 0.00000000 0.000000000 0.00000000
#> 2 3.000000 0.02360106 0.01955522 0.004430992 0.06728198
#> 3 3.300000 0.03651387 0.02940210 0.006585600 0.10774710
#> 4 3.600000 0.04266639 0.03329662 0.007747423 0.12837243
#> 5 3.900000 0.05312238 0.04334585 0.009734476 0.14772235
#> 6 4.200000 0.06215204 0.05221544 0.011553611 0.16409921
#> 7 4.500000 0.07516719 0.05978386 0.014209057 0.19666594Plot the cumulative incidence function for each failure with the historical longitudinal observations.
oldpar <- par(mfrow = c(2, 2), mar = c(5, 4, 4, 4))
plot(survfit, estimator = "both", include.y = TRUE)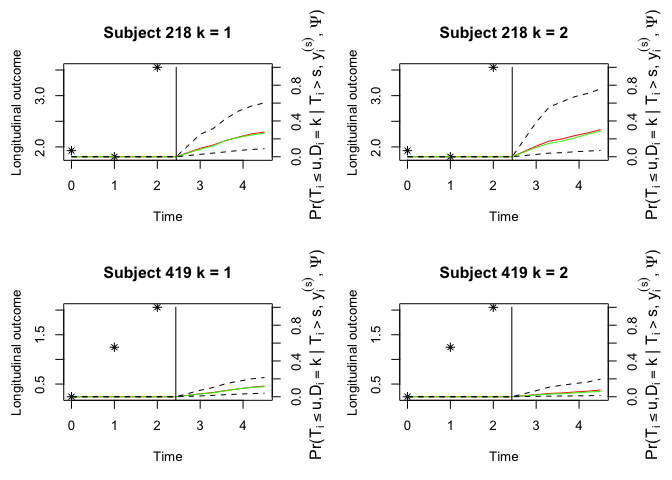
par(oldpar)