R package for Flexible dot plots
The FlexDotPlot package can be installed from GitHub by running
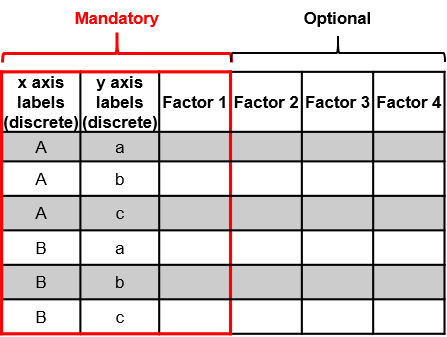
The FlexDotPlot package takes a data frame as input: the first two columns contain the two factors to spread along the x and y axes followed by the corresponding quantitative and/or qualitative data to be displayed :
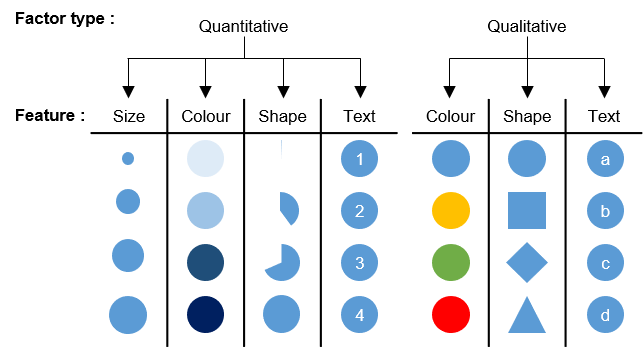
Users can specify which factor to display on the doplot and how each factor should be displayed :
The FlexDotPlot package contains the following functions :
1- The dot_plot() function to generate dot plot with command line. Function help is available with help(“dot_plot”).
Have a look on the FlexDotPlot tutorial or on the scripts to reproduce the article figures to see how we can use this function in details.
2- The Shiny_dot_plot() function to generate dot plot in an interactive way with a Shiny application.
3- The rotate_dot_plot_dendrogram() function to rotate dendrograms from dot_plot outputs.
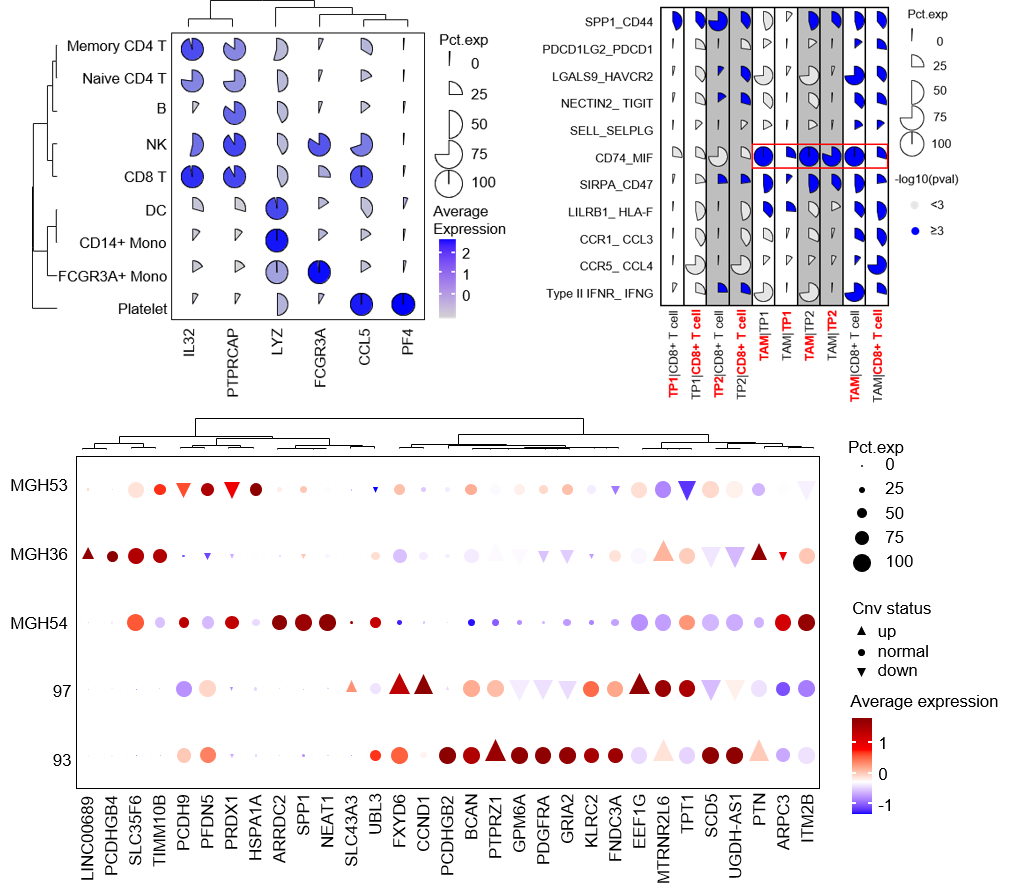
Here are some plots generated with FlexDotPlot (scripts to reproduce the figures)
Simon Leonard, Aurélie Lardenois, Karin Tarte, Antoine Rolland, Frédéric Chalmel,
FlexDotPlot: a universal and modular dot plot visualization tool for complex multifaceted data,
Bioinformatics Advances, 2022;, vbac019, https://doi.org/10.1093/bioadv/vbac019
See also the FlexDotPlot_paper repository to get the scripts used for analysis and figure generation in the FlexDotPlot paper
Don’t hesitate to contact me for any question/suggestion by opening an issue or sending me an email