
Input/Output Page
QRAGadget is a Shiny Gadget for creating interactive QRA visualizations. QRAGadget is powered by the excellent leaflet and raster packages. While this gadget was initially intended for those interested in creating QRA visualizations, it may also be more generally applicable to anyone interested in visualizing raster data in an interactive map.
To install QRAGadget in R:
devtools::install_github('paulgovan/QRAGadget')After installation, and if using RStudio (v0.99.878 or later), the gadget will appear in the Addins dropdown menu. Otherwise, to launch the gadget, simply type:
QRAGadget()QRAGadget currently accepts two primary types of raster data: (1) a file upload (in csv format) or (2) an R data.frame object. In order to explore the gadget, create some dummy data:
sample <- matrix(runif(36*36), ncol = 36, nrow = 36) %>%
  data.frame()
Then launch the app:
QRAGadget()Launching the app brings up the Input/Output page. To find the dummy data, click R Object under Data Type, and then select sample from the dropdown menu.
Choose a name for the output html file. After customizing the map, click Done to create a standalone html file in the working directory (Be sure not to save over a previously created map file!). Click Cancel any time to start over.
Input/Output Page
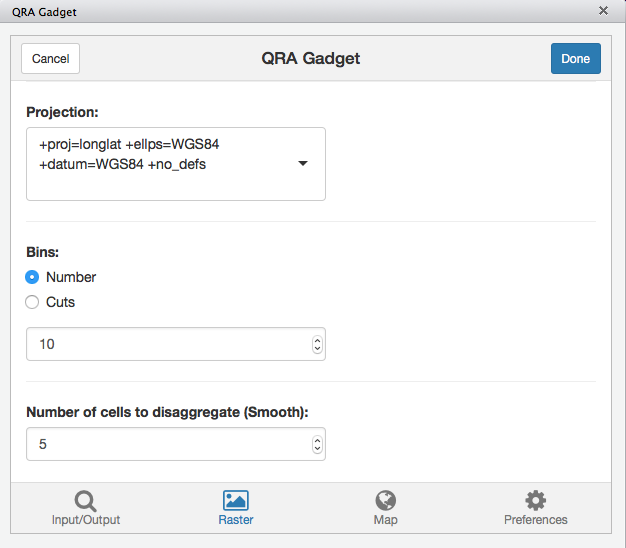
To format the raster image, click the Raster icon. Here are a number of options for specifying the extents of the raster image (XMIN, XMAX, YMIN, and YMAX) as well as the projection of the raster layer. It is very important that the raster layer be tagged with the correct project coordinate reference system.
To specify the bins for the color palette, click Number to select the total number of bins or Cuts to select both the number and the actual cut values for each bin.
Finally, there is an option to disaggregate the raster layer and create a new one with a higher resolution (smaller cells) while also locally interpolating between the new cell values (smoothed cells). To disaggregate the raster layer, check Smooth, and then enter the number of cells to disaggregate.
For this example, use the default values for XMIN, XMAX, YMIN, and YMAX as well as the given projection, but check Smooth and enter 5 as the number of cells to disaggregate:
Raster Page
To view the interactive map, click the Map icon. Click the Reset button at any time in order to reset the extents of the map.
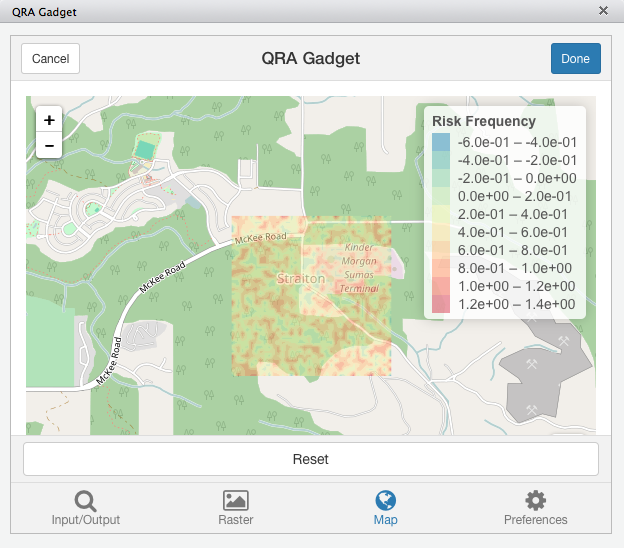
Map Page
The Preferences tab has a number of options for customizing the map:
To try out some of these options, select the PuOr Color Palette, the Esri.WorldImagery Map Tile, and move the Control Position over to the bottomleft:
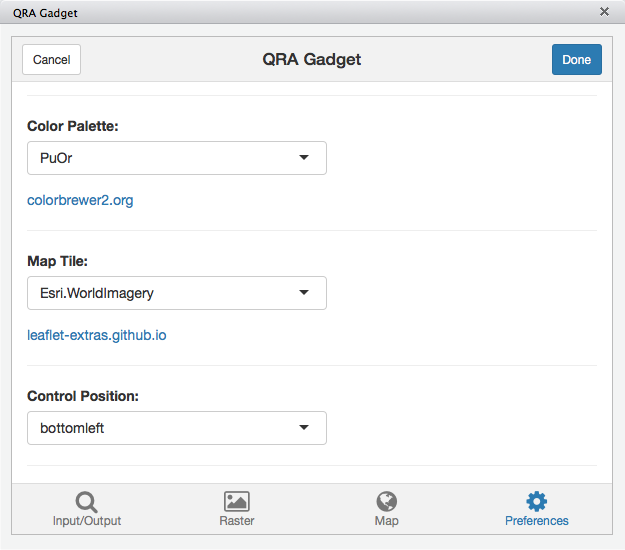
Preferences Page
This should result in the following interactive map:
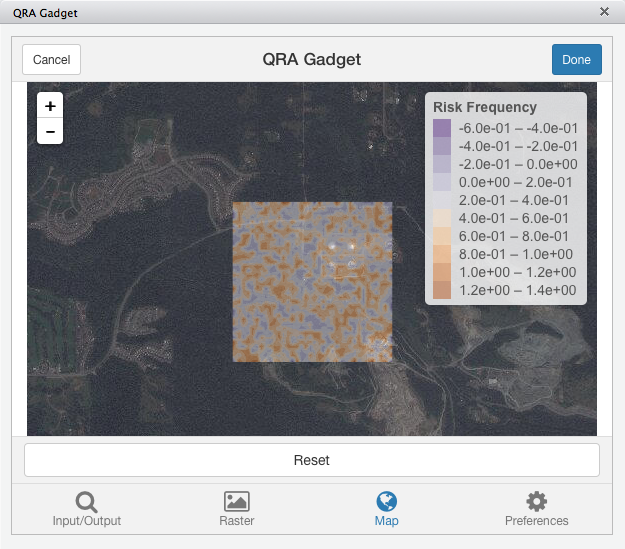
Map Page 2
QRAGadget is an open source project, and the source code is available at https://github.com/paulgovan/QRAGadget
This project is in its very early stages. Please let us know if there are things you would like to see (or things you don't like!) by opening up an issue using the GitHub issue tracker at https://github.com/paulgovan/QRAGadget/issues
Contributions are welcome by sending a pull request
QRAGadget is licensed under the Apache licence. © Paul Govan (2016)