
TREXr allows to assimilate, process and analyse sap flow data obtained with the thermal dissipation method (TDM). The package includes functions for gap filling time-series data, detecting outliers, calculating data-processing uncertainties and generating uniform data output and visualisation. The package is designed to deal with large quantities of data and apply commonly used data-processing methods. The functions have been validated on data collected from different tree species across the northern hemisphere (Peters et al. 2018 <doi: 10.1111/nph.15241>).
A development version of TREXr can be installed and used via
# load raw data
raw   <- is.trex(example.data(type="doy"),
                 tz="GMT",
                 time.format="%H:%M",
                 solar.time=TRUE,
                 long.deg=7.7459,
                 ref.add=FALSE)

# adjust time steps
input <- dt.steps(input=raw,
                start="2013-05-01 00:00",
                end="2013-11-01 00:00",
                time.int=15,
                max.gap=60,
                decimals=10,
                df=FALSE)

# remove obvious outliers
input[which(input<0.2)]<- NA
Three methods can be applied to calculate ΔT (or ΔV for voltage differences between TDM probes):
pd: pre-dawnmw: moving-windowdr: double-regressioninput <- tdm_dt.max(input,
methods = c("pd", "mw", "dr"),
det.pd = TRUE,
interpolate = FALSE,
max.days = 10,
df = FALSE)
plot(input$input, ylab = expression(Delta*italic("V")))
lines(input$max.pd, col = "green")
lines(input$max.mw, col = "blue")
lines(input$max.dr, col = "orange")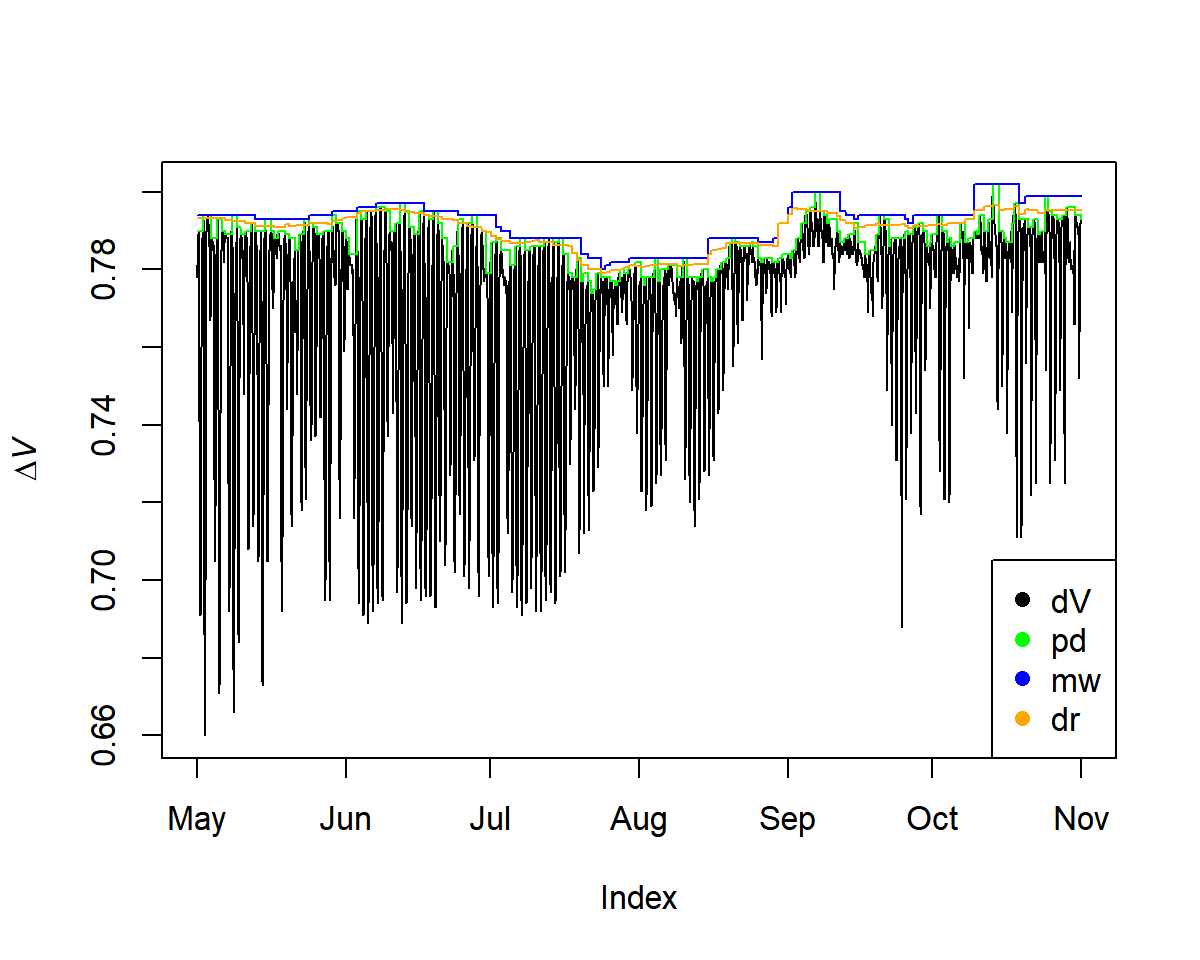
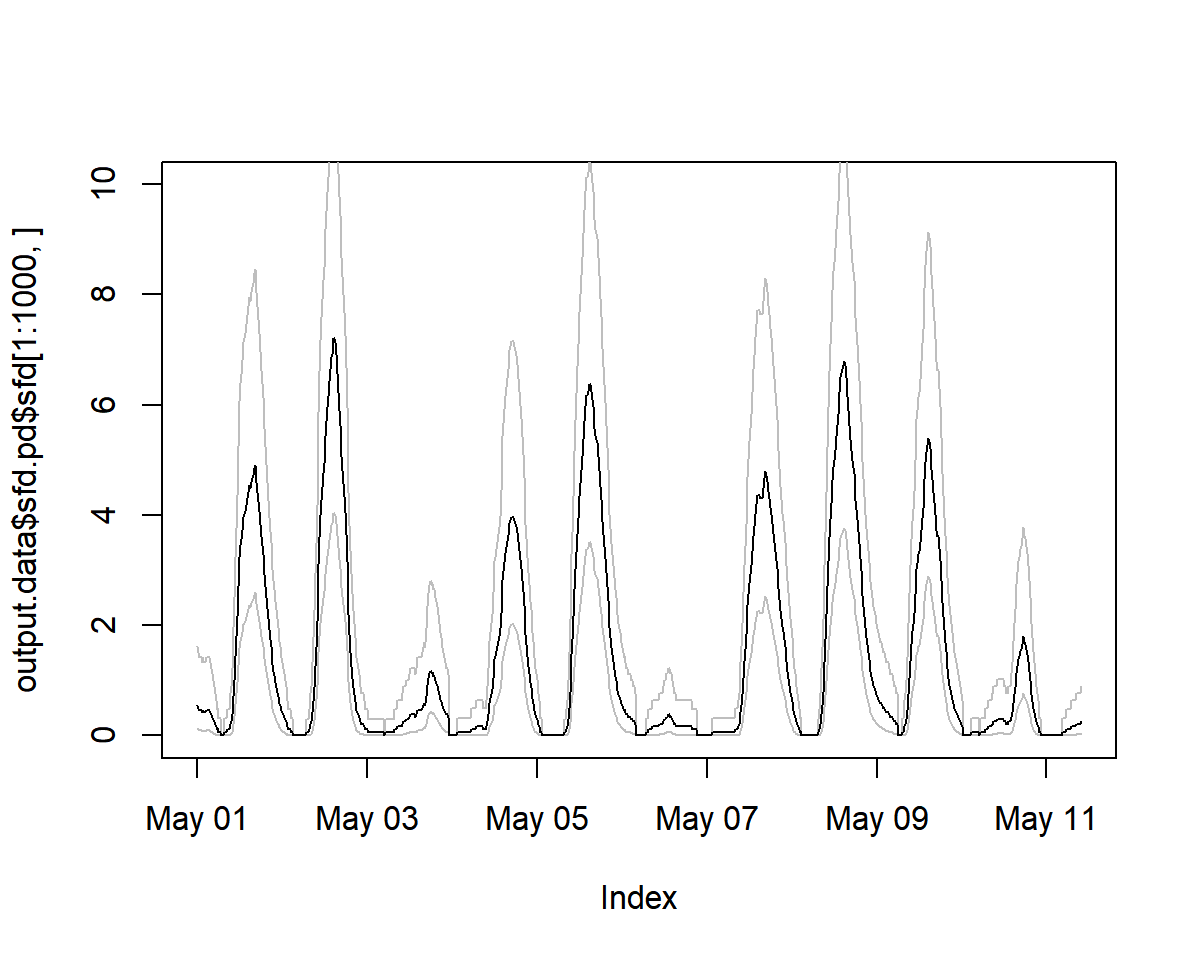
output.data<- tdm_cal.sfd(input,make.plot=TRUE,df=FALSE,wood="Coniferous")

plot(output.data$sfd.pd$sfd[1:1000, ], ylim=c(0,10))
# see estimated uncertainty
lines(output.data$sfd.pd$q025[1:1000, ], lty=1,col="grey")
lines(output.data$sfd.pd$q975[1:1000, ], lty=1,col="grey")
lines(output.data$sfd.pd$sfd[1:1000, ])

sfd_data <- output.data$sfd.dr$sfd
Here we generate outputs based on environmental filters and calculate crown conductance (Gc) values.
output<- out.data(input=sfd_data,
                  vpd.input=vpd,
                  sr.input=sr,
                  prec.input=preci,
                  low.sr = 150,
                  peak.sr=300,
                  vpd.cutoff= 0.5,
                  prec.lim=1,
                  method="env.filt",
                  max.quant=0.99,
                  make.plot=TRUE)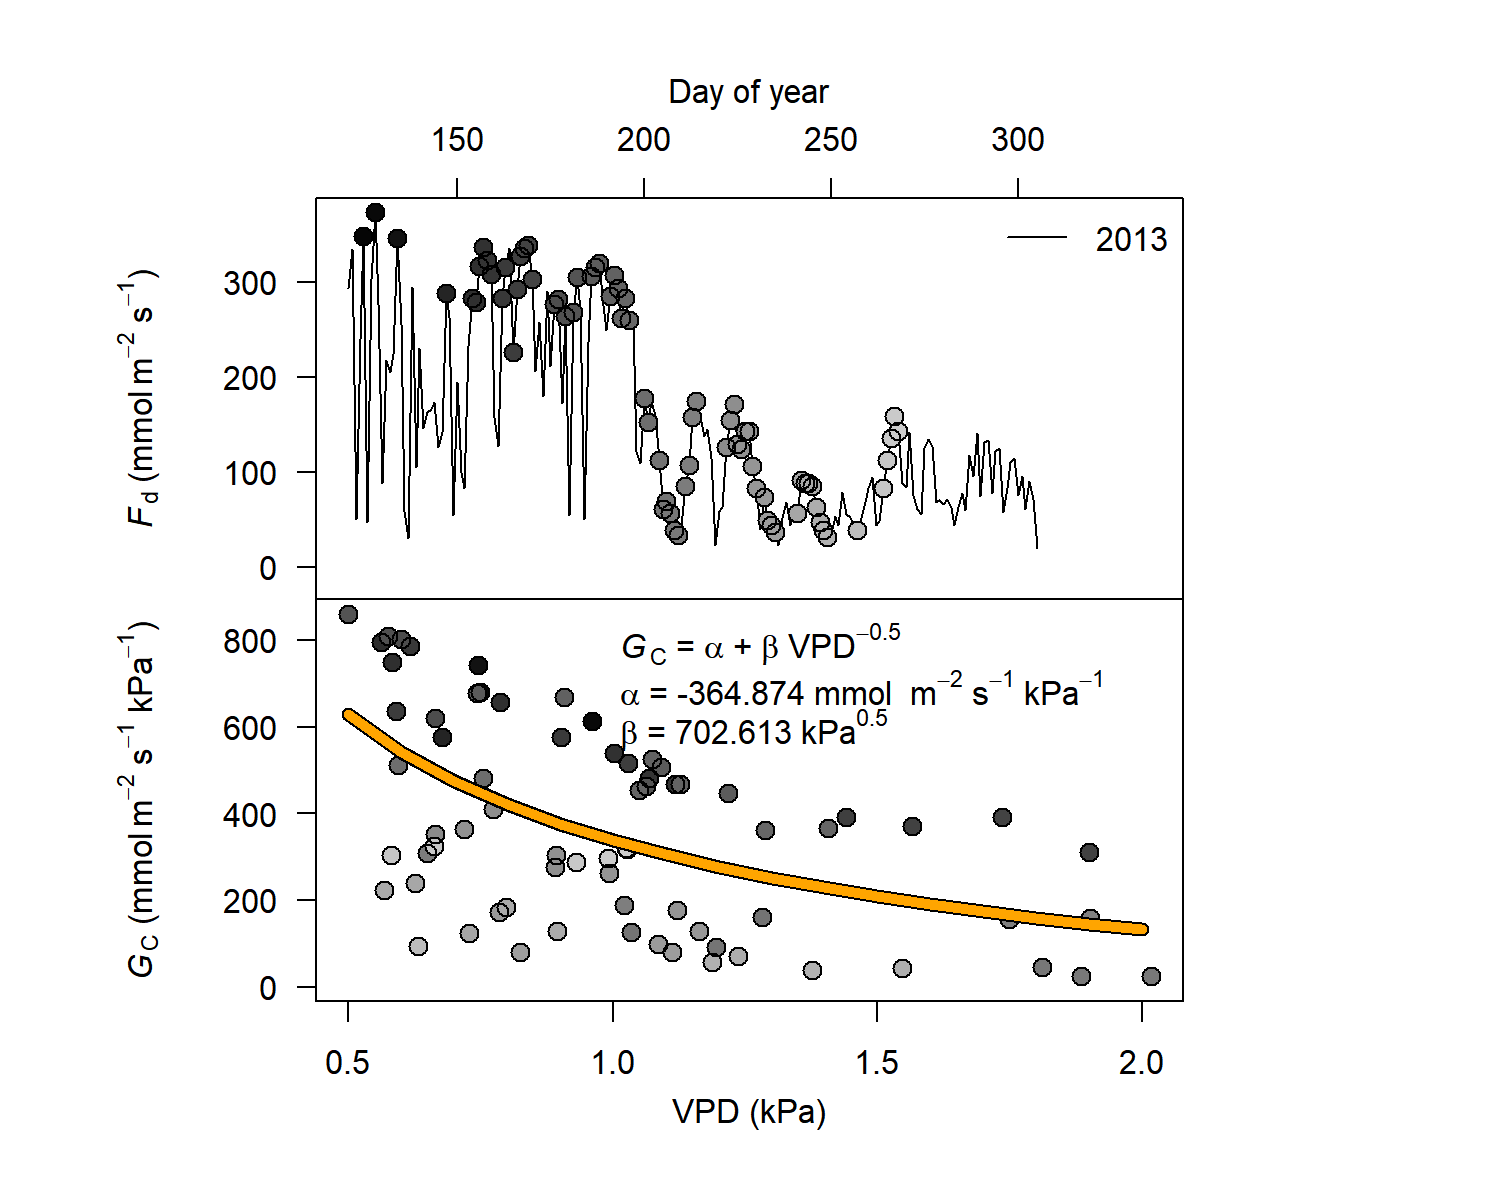
TREXrTREXrTREXr was introduced and demonstrated in detail in a workshop during the Ecological Society of America’s 2020 AGM. The workshop description can be found here, and all materials on the dedicated page.