![]()
![]()

mapsfThere are no plans for new features or enhancements in cartography. Basic maintenance and support will continue indefinitely. Existing projects that use cartography can safely continue to use cartography. The mapsf R package is the successor of cartography and it is friendlier, lighter and more robust. See mapsf vignette or this blog post to migrate from cartography to mapsf.
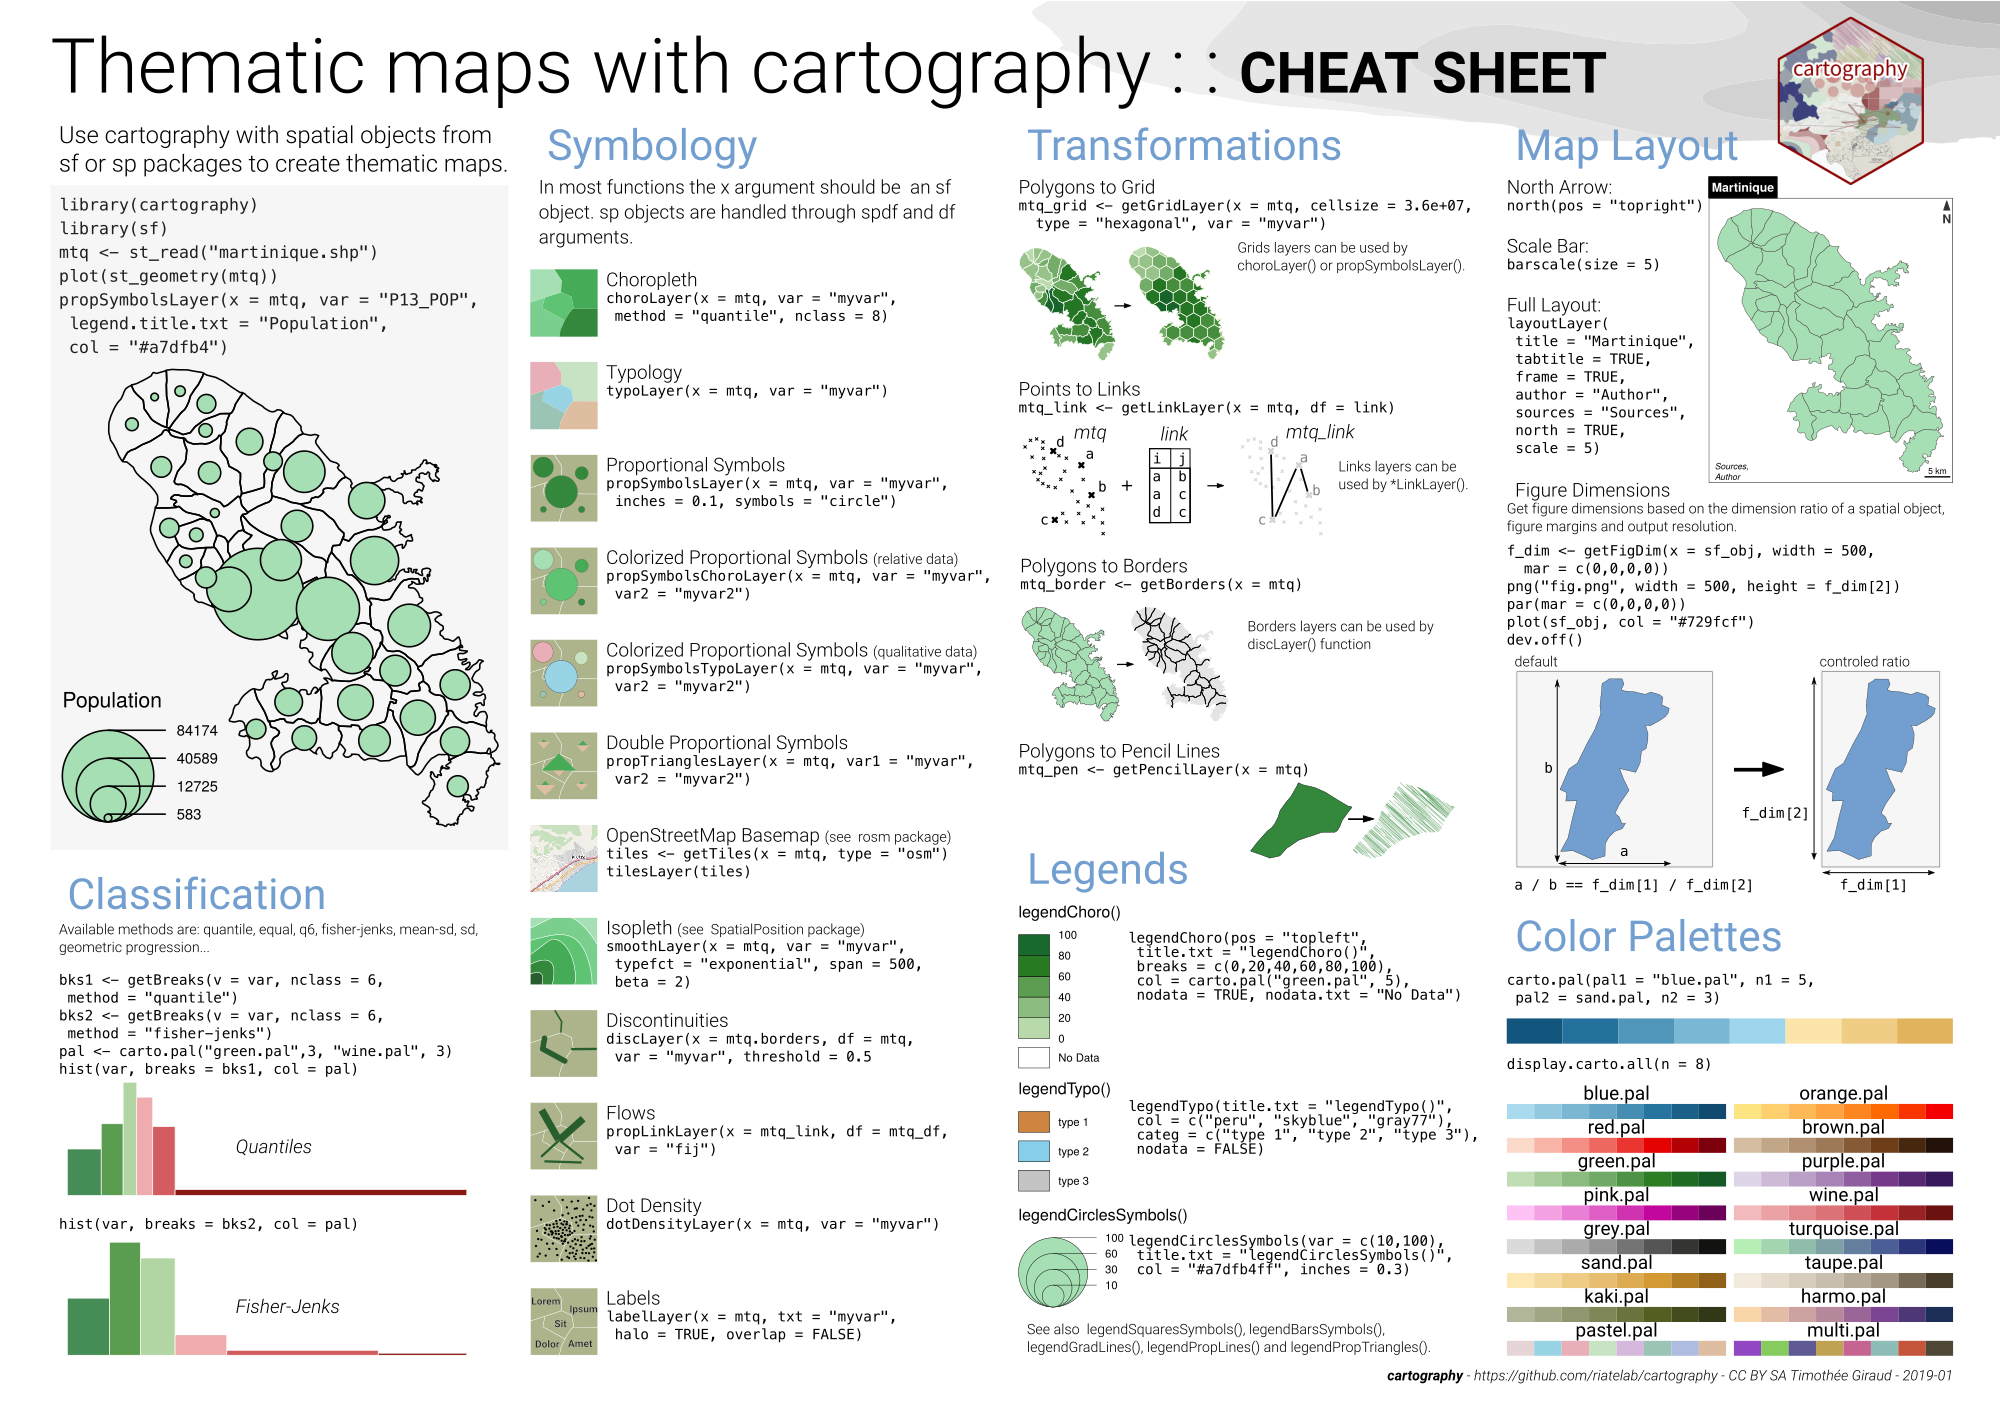
This package helps to design cartographic representations such as proportional symbols, choropleth, typology, flows or discontinuities maps. It also offers several features that improve the graphic presentation of maps, for instance, map palettes, layout elements (scale, north arrow, title…), labels or legends.
The cheat sheet displays a quick overview of cartography’s main features.
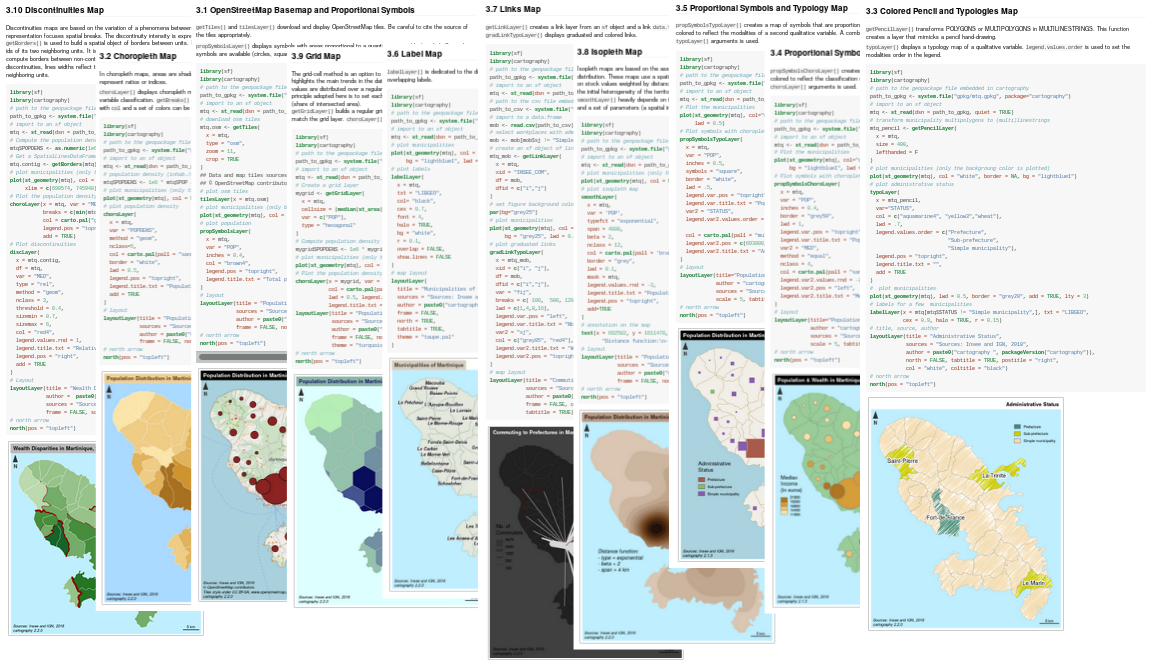
The vignette contains commented scripts on how to build various types of maps with cartography:
cartography. useR! 2019. Toulouse, France. (EN)The following script creates a map of symbols that are proportional to values of a first variable and colored to reflect the classification of a second variable.
library(sf)
library(cartography)
# path to the geopackage file embedded in cartography
path_to_file <- system.file("gpkg/mtq.gpkg", package="cartography")
# import to an sf object
mtq <- st_read(dsn = path_to_file, quiet = TRUE)

########## Draft Map
# Plot the municipalities
plot(st_geometry(mtq))
# Plot symbols with choropleth coloration (population & median income)
propSymbolsChoroLayer(x = mtq, var = "POP", var2 = "MED")
# Add a layout
title(main = "Population & Wealth in Martinique, 2015",
      sub = "Sources: Insee and IGN - 2018")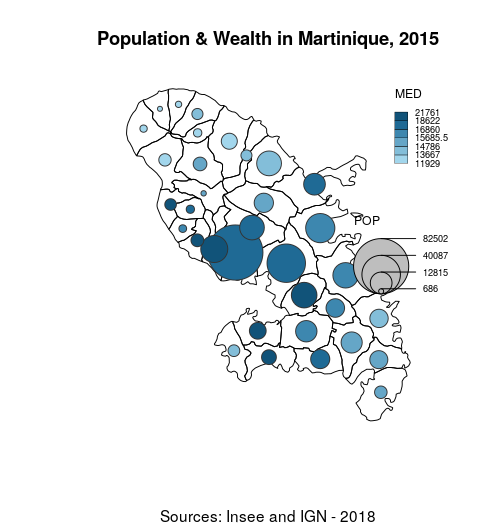
########## Final Map
# Set figure margins
opar <- par(mar = c(0,0,1.2,0))
# Plot the municipalities
plot(st_geometry(mtq), col="darkseagreen3", border="darkseagreen4",
     bg = "lightblue1", lwd = 0.5)
# Plot symbols with choropleth coloration
propSymbolsChoroLayer(x = mtq, var = "POP", inches = 0.4, border = "grey50",
                      lwd = 1, legend.var.pos = "topright",
                      legend.var.title.txt = "Population",
                      var2 = "MED", method = "equal", nclass = 4,
                      col = carto.pal(pal1 = "sand.pal", n1 = 4),
                      legend.var2.values.rnd = -2,  legend.var2.pos = "left",
                      legend.var2.title.txt = "Median Income\n(in euros)")
# Plot a layout
layoutLayer(title="Population & Wealth in Martinique, 2015",
            author = "cartography 2.1.3",
            sources = "Sources: Insee and IGN - 2018",
            scale = 5, tabtitle = TRUE, frame = FALSE)
# Plot a north arrow
north(pos = "topleft")
# restore graphics parameters
par(opar)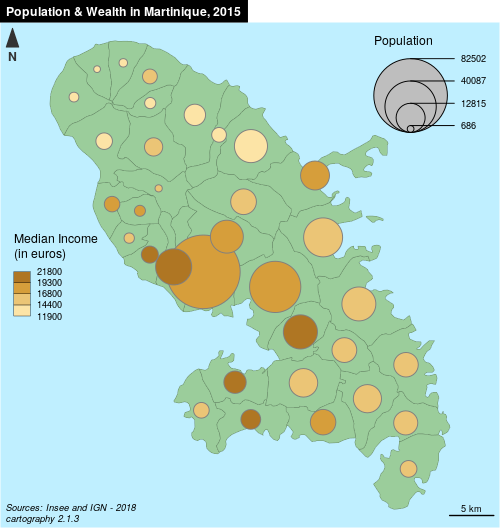
require(remotes)
install_github("riatelab/cartography")install.packages("cartography")One can contribute to the package through pull requests and report issues or ask questions here.
