
![]()
![]()
![]()
dabestr is a package for Data Analysis using Bootstrap-Coupled ESTimation.
Estimation statistics is a simple framework that avoids the pitfalls of significance testing. It uses familiar statistical concepts: means, mean differences, and error bars. More importantly, it focuses on the effect size of one’s experiment/intervention, as opposed to a false dichotomy engendered by P values.
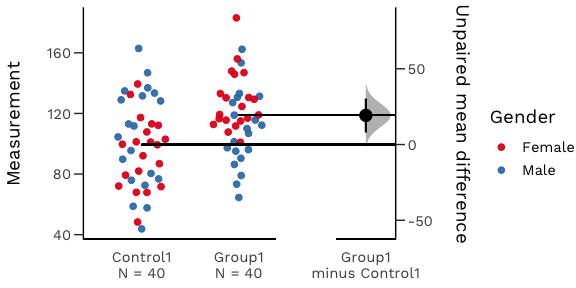
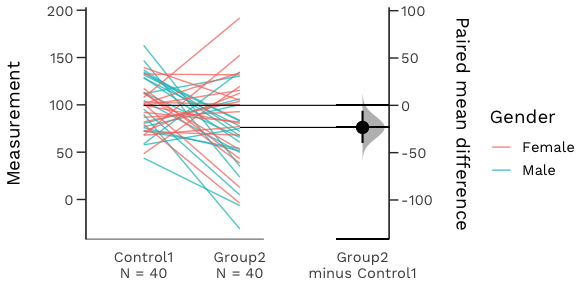
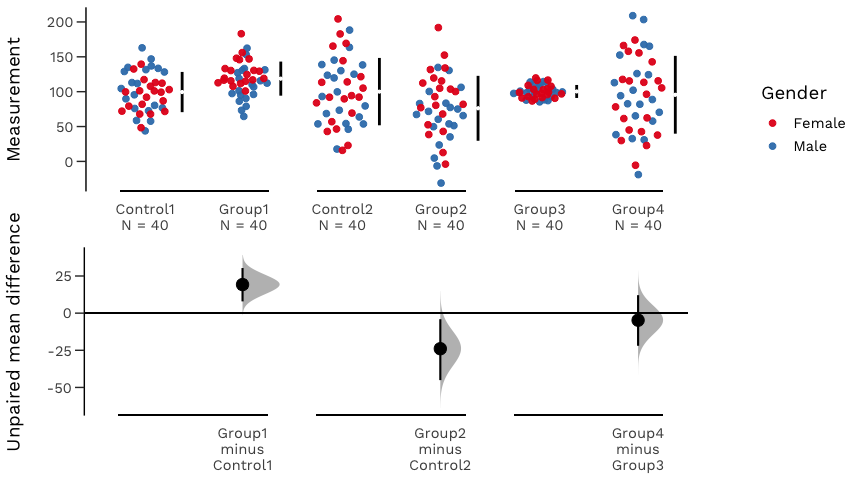
An estimation plot has two key features.
It presents all datapoints as a swarmplot, which orders each point to display the underlying distribution.
It presents the effect size as a bootstrap 95% confidence interval on a separate but aligned axes.


Your version of R must be 3.5.0 or higher.
install.packages("dabestr")

# To install the latest development version on Github,
# use the line below.
devtools::install_github("ACCLAB/dabestr")library(dabestr)
# Performing unpaired (two independent groups) analysis.
unpaired_mean_diff <- dabest(iris, Species, Petal.Width,
idx = c("setosa", "versicolor", "virginica"),
paired = FALSE) %>%
mean_diff()
# Display the results in a user-friendly format.
unpaired_mean_diff
#> DABEST (Data Analysis with Bootstrap Estimation in R) v0.3.0
#> ============================================================
#>
#> Good morning!
#> The current time is 11:10 AM on Monday July 13, 2020.
#>
#> Dataset : iris
#> X Variable : Species
#> Y Variable : Petal.Width
#>
#> Unpaired mean difference of versicolor (n=50) minus setosa (n=50)
#> 1.08 [95CI 1.01; 1.14]
#>
#> Unpaired mean difference of virginica (n=50) minus setosa (n=50)
#> 1.78 [95CI 1.69; 1.85]
#>
#>
#> 5000 bootstrap resamples.
#> All confidence intervals are bias-corrected and accelerated.
# Produce a Cumming estimation plot.
plot(unpaired_mean_diff)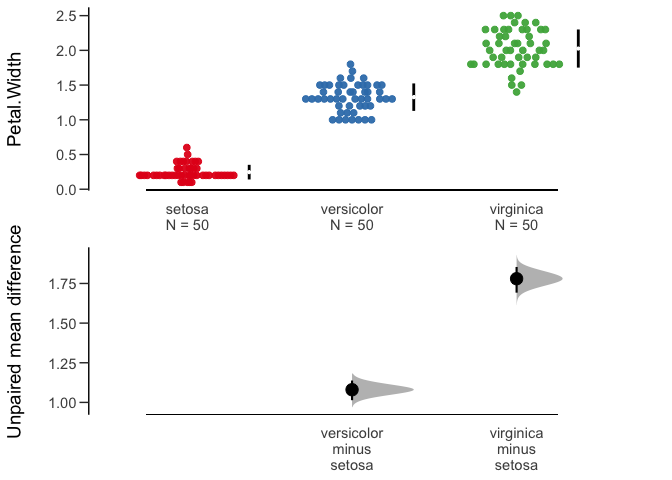
You will find more useful code snippets in this vignette.
Moving beyond P values: Everyday data analysis with estimation plots
Joses Ho, Tayfun Tumkaya, Sameer Aryal, Hyungwon Choi, Adam Claridge-Chang
Nature Methods 2019, 1548-7105. 10.1038/s41592-019-0470-3
Paywalled publisher site; Free-to-view PDF
Please open a new issue. Include a reproducible example (aka reprex) so anyone can copy-paste your code and move quickly towards helping you out!
All contributions are welcome; please read the Guidelines for contributing first.
We also have a Code of Conduct to foster an inclusive and productive space.