
![]()
![]()
The goal of edwards97 is to implement the Edwards (1997) Langmuir-based semiempirical coagulation model, which predicts the concentration of organic carbon remaining in water after treatment with an Al- or Fe-based coagulant. Methods and example data are provided to optimise empirical coefficients.
This package is experimental, under constant development, and is in no way guaranteed to give accurate predictions (yet).
You can install the development version from GitHub with:
This is a basic example which shows you how to solve a common problem:
library(edwards97)

fit_data_alum <- edwards_data("Al")

# optimise coefficients for this dataset
fit <- fit_edwards_optim(fit_data_alum, initial_coefs = edwards_coefs("Al"))

# view fit results
print(fit)
#> <edwards_fit_optim>
#>   Fit optimised for `fit_data_alum`
#>   Coefficients:
#>     x3 = 5.22, x2 = -76.2, x1 = 282, K1 = -0.0328, K2 = 0.264, b = 0.0823, root = -1
#>   Performance:
#>     r² = 0.953, RMSE = 0.959 mg/L, number of finite observations = 500
#>   Input data:
#>       DOC             dose              pH            UV254
#>  Min.   : 1.80   Min.   :0.0084   Min.   :4.500   Min.   :0.0260
#>  1st Qu.: 2.81   1st Qu.:0.1323   1st Qu.:5.808   1st Qu.:0.0810
#>  Median : 3.94   Median :0.2290   Median :6.500   Median :0.1060
#>  Mean   : 6.36   Mean   :0.2644   Mean   :6.430   Mean   :0.2323
#>  3rd Qu.: 6.70   3rd Qu.:0.3543   3rd Qu.:6.955   3rd Qu.:0.2470
#>  Max.   :26.50   Max.   :1.5152   Max.   :7.900   Max.   :1.3550
#>  NA's   :629     NA's   :629      NA's   :629     NA's   :629
#>    DOC_final       Predictions       Langmuir a     Sorbable DOC (%)
#>  Min.   : 1.030   Min.   : 0.683   Min.   : 23.94   Min.   :78.25
#>  1st Qu.: 1.968   1st Qu.: 1.874   1st Qu.: 28.63   1st Qu.:80.88
#>  Median : 2.700   Median : 2.691   Median : 43.43   Median :83.25
#>  Mean   : 3.793   Mean   : 3.732   Mean   : 58.28   Mean   :83.67
#>  3rd Qu.: 4.025   3rd Qu.: 4.353   3rd Qu.: 87.19   3rd Qu.:85.40
#>  Max.   :26.610   Max.   :19.820   Max.   :199.74   Max.   :92.41
#>  NA's   :629      NA's   :629      NA's   :629      NA's   :629
plot(fit)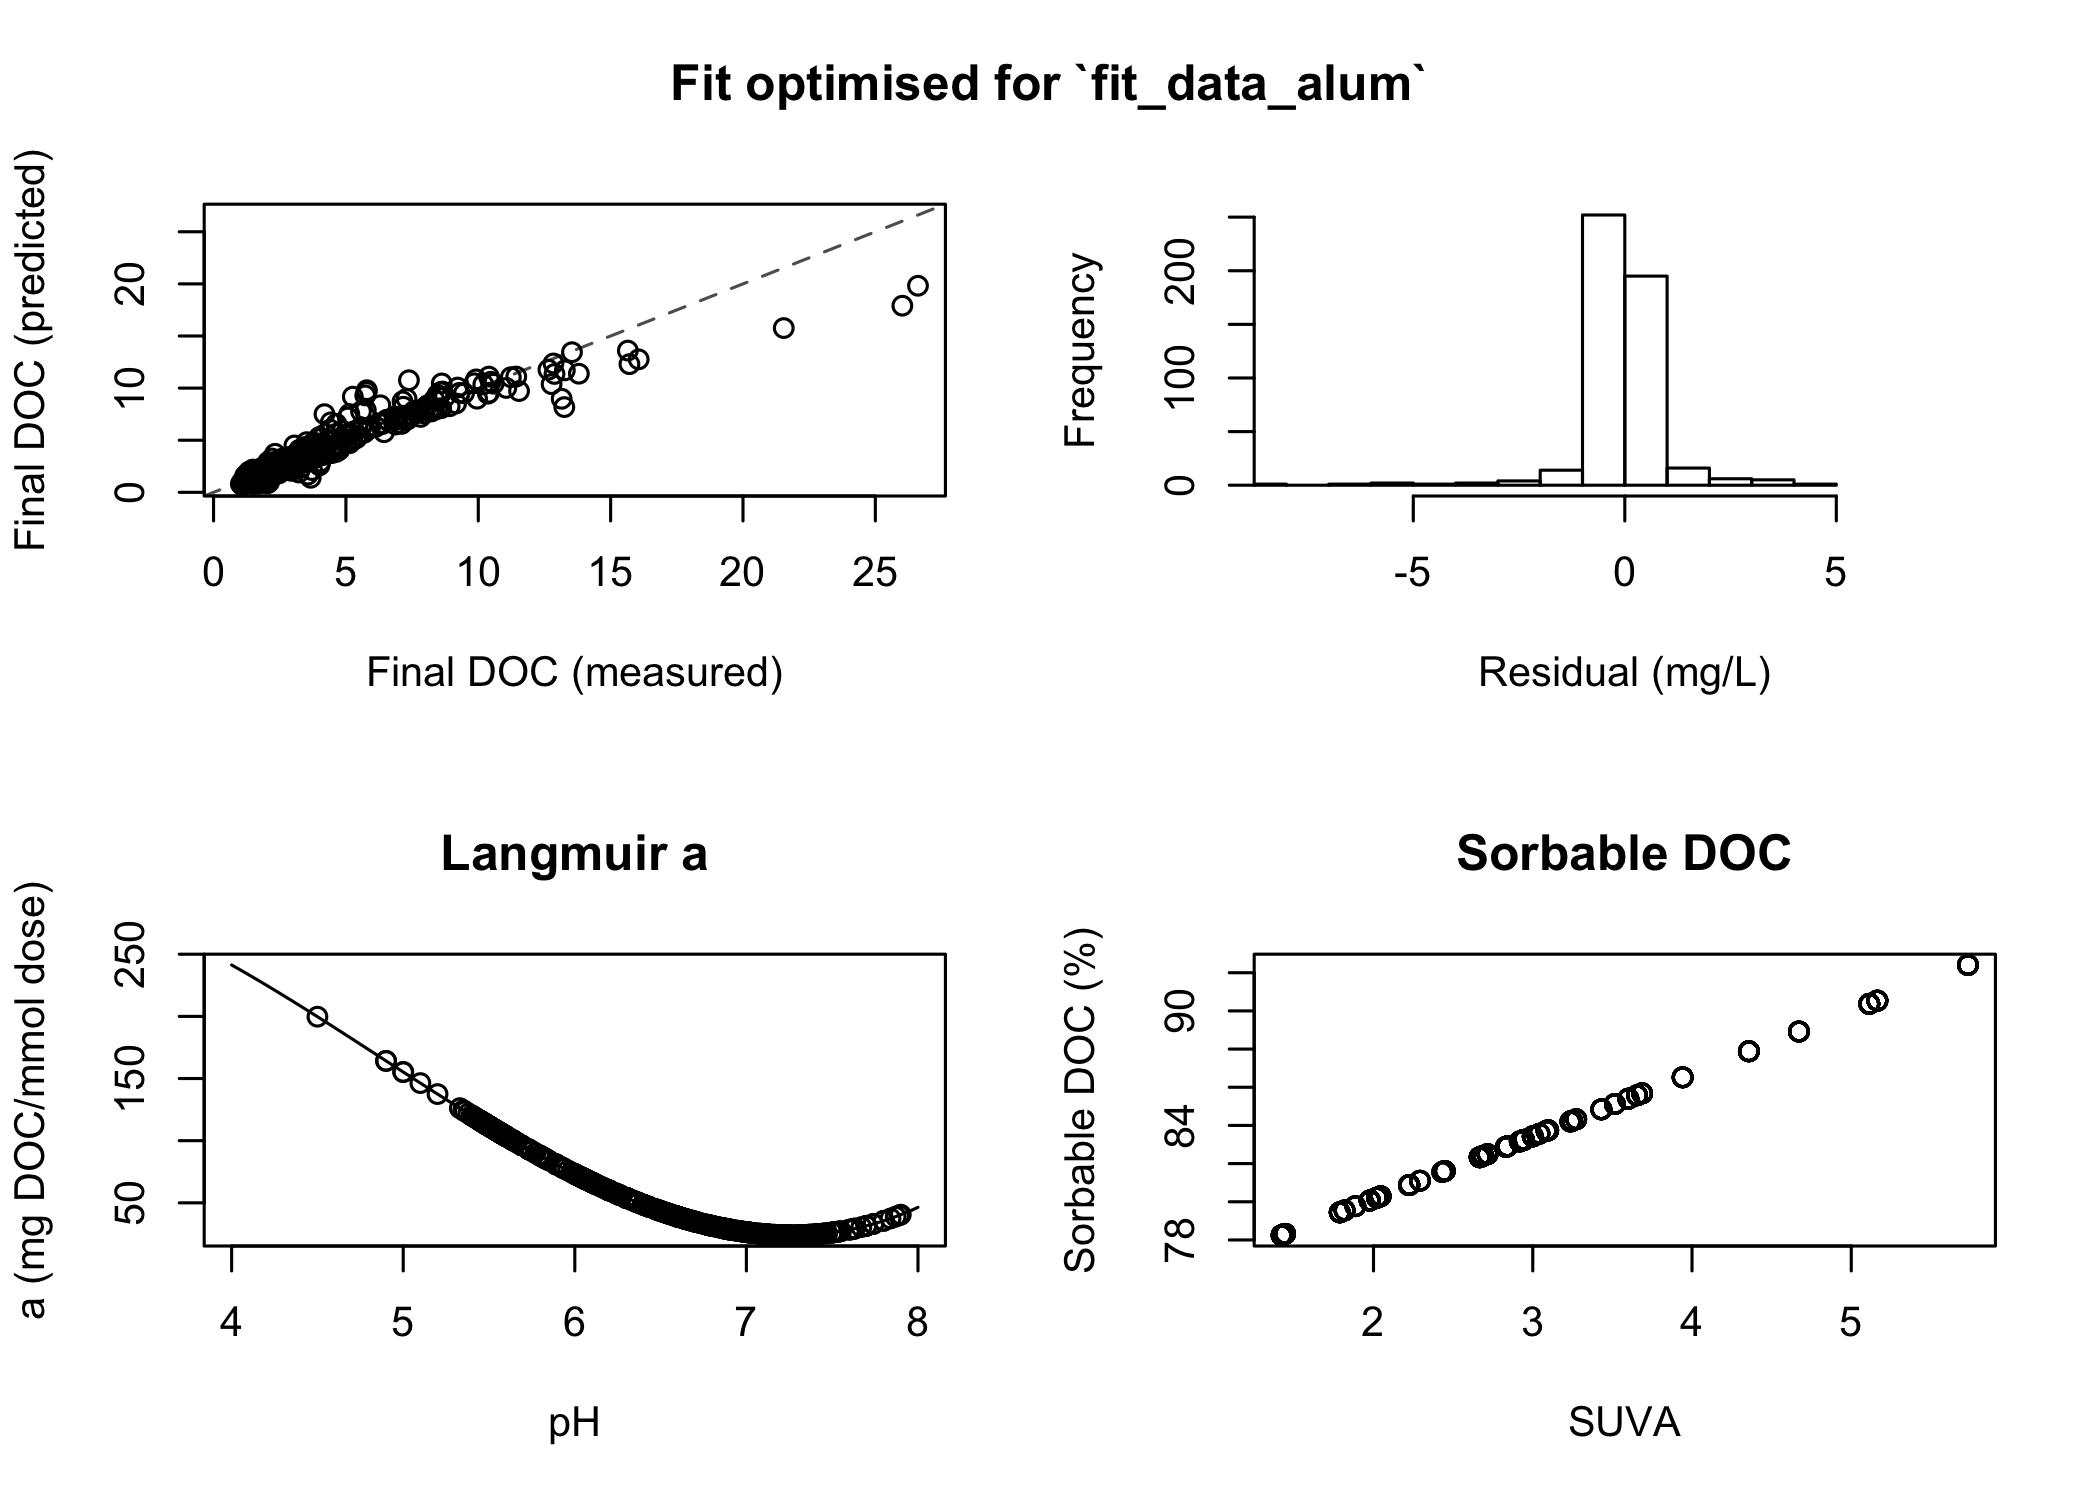
Using the fit, you can make predictions about unknown inputs:
grid <- coagulate_grid(fit, DOC = c(4, 8), UV254 = c(0.2, 0.4)) %>%
  mutate(label = glue::glue("DOC: {DOC} mg/L, UV254: {UV254} 1/cm"))

diminishing_returns <- grid %>%
  group_by(label, pH) %>%
  summarise(dose = dose_of_diminishing_returns(dose, DOC_final, threshold = 0.3 / 10))

ggplot(grid, aes(x = dose, y = pH)) +
  geom_raster(aes(fill = DOC_final)) +
  geom_path(data = diminishing_returns, col = "red", size = 1) +
  facet_wrap(vars(label)) +
  coord_cartesian(expand = FALSE)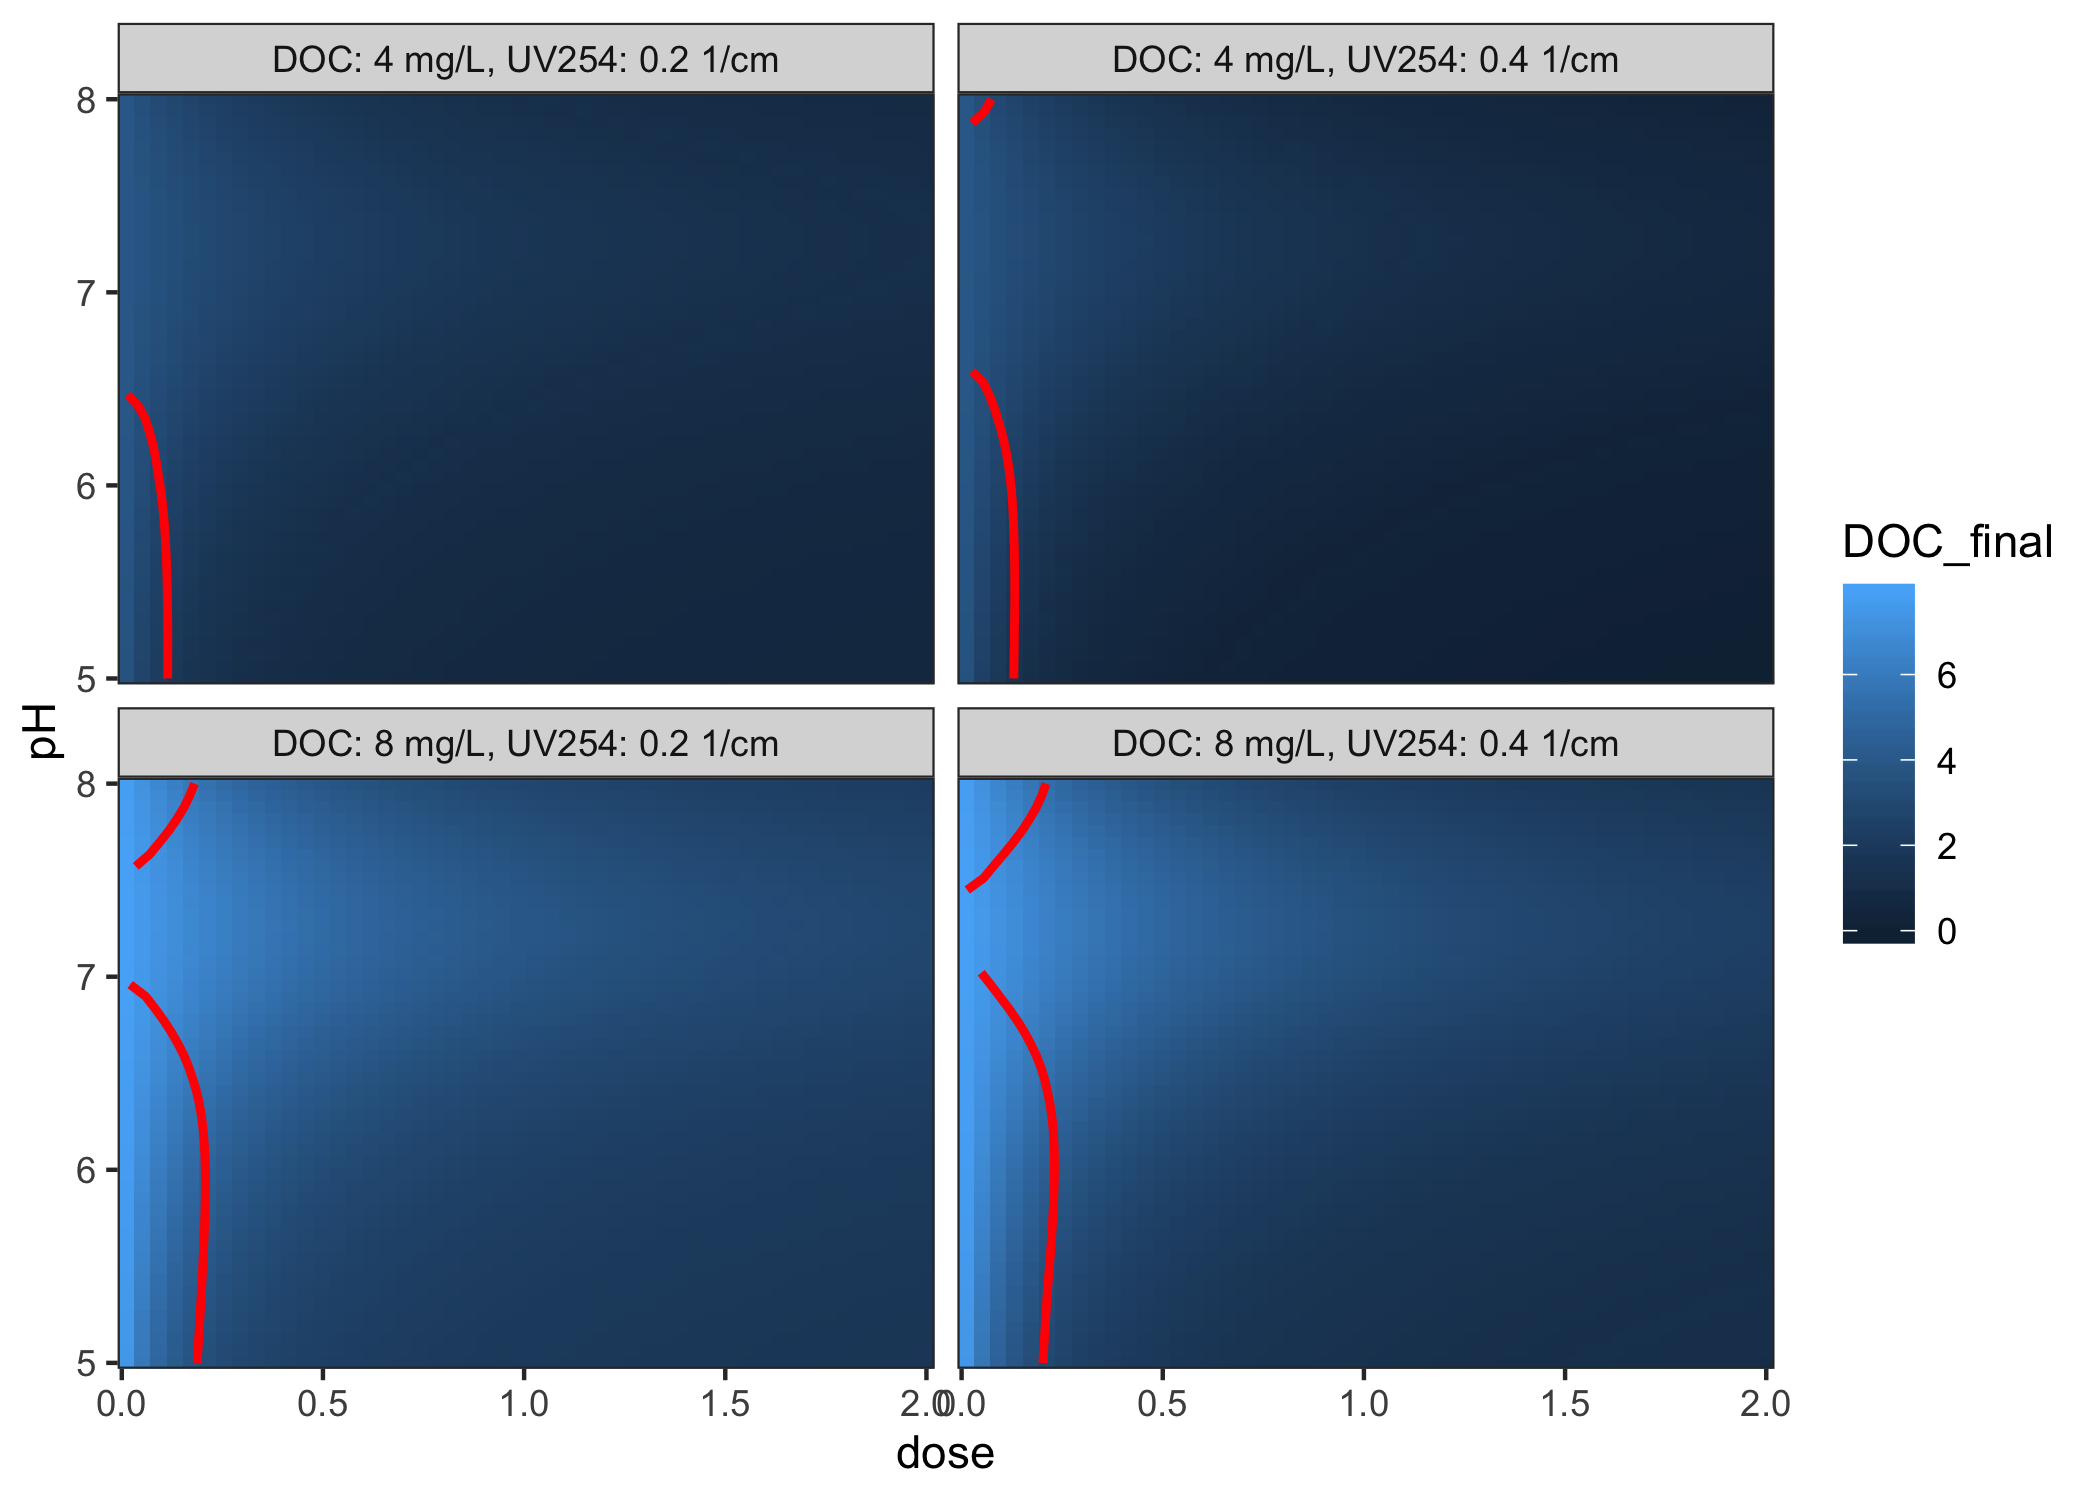
Edwards, M. 1997. Predicting DOC removal during enhanced coagulation. Journal - American Water Works Association, 89: 78–89. https://doi.org/10.1002/j.1551-8833.1997.tb08229.x