
![]()
emstreeR enables R users to fast and easily compute an Euclidean Minimum Spanning Tree (EMST) from data. This package relies on the R API for {mlpack} - the C++ Machine Learning Library (Curtin et. al., 2013). {emstreeR} uses the Dual-Tree Boruvka (March, Ram, Gray, 2010, https://doi.org/10.1145/1835804.1835882), which is theoretically and empirically the fastest algorithm for computing an EMST. This package also provides functions and an S3 method for readily plotting Minimum Spanning Trees (MST) using either the style of the {base}, {scatterplot3d}, or {ggplot2} libraries.
computeMST() computes an Euclidean Minimum Spanning Tree for the input data.plot.MST() an S3 method for the generic function plot() that produces 2D MST plots.plotMST3D() plots a 3D MST using the {scatterplot3d} style.stat_MST() a {ggplot2} Stat extension for plotting a 2D MST.# CRAN version
install.packages("emstreeR")
# Dev version
if (!require('devtools')) install.packages('devtools')
devtools::install_github("allanvc/emstreeR")## artificial data:
set.seed(1984)
n <- 7
c1 <- data.frame(x = rnorm(n, -0.2, sd = 0.2), y = rnorm(n, -2, sd = 0.2))
c2 <- data.frame(x = rnorm(n, -1.1, sd = 0.15), y = rnorm(n, -2, sd = 0.3))
d <- rbind(c1, c2)
d <- as.data.frame(d)
## MST:
library(emstreeR)
out <- ComputeMST(d)## [0;32m[INFO ] [0mBuilding tree.
## [0;32m[INFO ] [0mCalculating minimum spanning tree.
## [0;32m[INFO ] [0m9 edges found so far.
## [0;32m[INFO ] [0m18 cumulative base cases.
## [0;32m[INFO ] [0m89 cumulative node combinations scored.
## [0;32m[INFO ] [0m12 edges found so far.
## [0;32m[INFO ] [0m31 cumulative base cases.
## [0;32m[INFO ] [0m182 cumulative node combinations scored.
## [0;32m[INFO ] [0m13 edges found so far.
## [0;32m[INFO ] [0m36 cumulative base cases.
## [0;32m[INFO ] [0m237 cumulative node combinations scored.
## [0;32m[INFO ] [0mTotal spanning tree length: 2.49929## x y from to distance
## 1 -0.118159357 -2.166545 11 13 0.03281747
## 2 -0.264604994 -2.105242 8 12 0.05703382
## 3 -0.072829535 -1.716803 3 7 0.08060398
## 4 -0.569225757 -1.943598 5 6 0.11944501
## 5 -0.009270527 -1.942413 6 7 0.13450475
## 6 0.037697969 -1.832590 8 10 0.14293342
## 7 -0.091509110 -1.795213 1 2 0.15875908
## 8 -1.097338236 -1.871078 10 14 0.16993335
## 9 -0.841400898 -2.194585 1 5 0.24918237
## 10 -1.081888729 -1.728982 8 13 0.27882008
## 11 -1.366334073 -2.003965 2 4 0.34485145
## 12 -1.081078171 -1.925745 9 12 0.36016689
## 13 -1.357063682 -1.972485 4 9 0.37023475
## 14 -0.913706515 -1.753315 1 1 0.00000000## artifical data for 2D plots:
set.seed(1984)
n <- 15
c1 <- data.frame(x = rnorm(n, -0.2, sd = 0.2), y = rnorm(n, -2, sd = 0.2))
c2 <- data.frame(x = rnorm(n, -1.1, sd = 0.15), y = rnorm(n, -2, sd = 0.3))
d <- rbind(c1, c2)
d <- as.data.frame(d)
## MST:
library(emstreeR)
out <- ComputeMST(d, verbose = FALSE)
## 2D plot with ggplot2:
library(ggplot2)
ggplot(data = out, aes(x = x, y = y, from = from, to = to))+
  geom_point()+
  stat_MST(colour="red")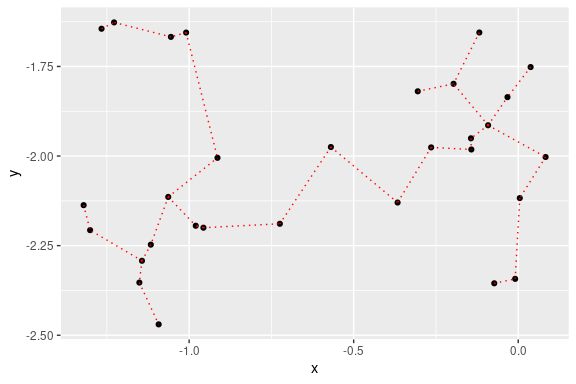
## 2D curved edges plot with ggplot2:
library(ggplot2)
ggplot(data = out, aes(x = x, y = y, from = from, to = to))+
  geom_point()+
  stat_MST(geom="curve")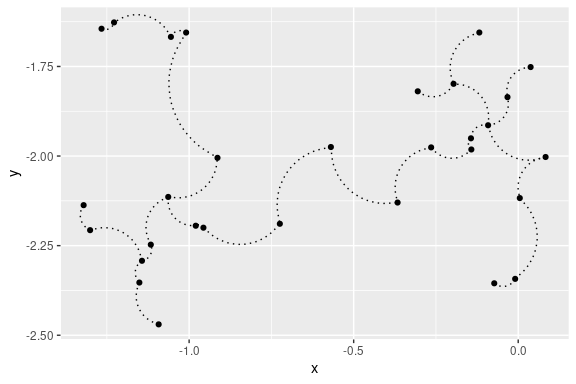
## artificial data for 3D plots:
n = 99
set.seed(1984)
d1 <- matrix(rnorm(n, mean = -2, sd = .5), n/3, 3) # 3d
d2 <- matrix(rnorm(n, mean = 0, sd = .3), n/3, 3)
d3 <- matrix(rnorm(n, mean = 3, sd = .4), n/3, 3)
d <- rbind(d1,d2,d3) # showing a matrix input

## MST:
library(emstreeR)
out <- ComputeMST(d, verbose = FALSE)
## simple 3D plot:
plotMST3D(out, xlab = "xaxis", col.pts = "orange", col.segts = "red", main = "a simple MST 3D plot")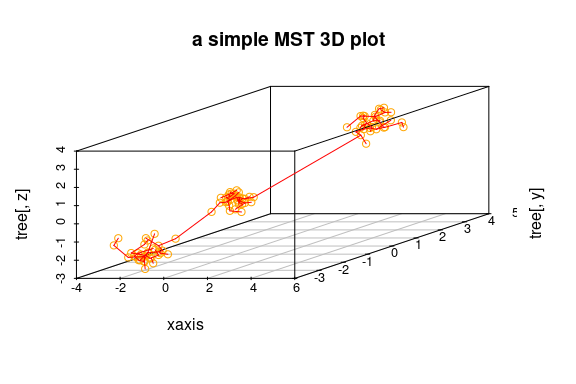
This package is licensed under the terms of the BSD 3-clause License.
March, W. B., and Ram, P., and Gray, A. G. (2010). Fast euclidian minimum spanning tree: algorithm analysis, and applications. 16th ACM SIGKDD International Conference on Knowledge Discovery and Data mining, July 25-28 2010. Washington, DC, USA.
Curtin, R. R. et al. (2013). Mlpack: A scalable C++ machine learning library. Journal of Machine Learning Research, v. 14, 2013.