![]()
Package ‘gginnards’ (Explore the innards of ‘ggplot2’) is a set of extensions to R package ‘ggplot2’ and tools specially useful when learning how to write extensions and when debugging newly defined stats and geoms.
Occasionally it may be useful to edit gg objects. A typical case are packages that provide extensions to ‘ggplot2’ that construct and return whole gg objects instead of new statistics and geometries. In such cases in can be useful to programatically edit these gg objects. Functions are provided for the manipulation of layers within ggobjects.
As the variables returned in data by many statistics depend on input, some of these tools can be also useful in everyday plotting with ggplot2.
This package was born when several functions were removed from package ‘ggpmisc’.
geom_debug() by default prints the data object received as input to the console and generates no graphic output. As it takes as argument a summary function, it allows great flexibility in how data is displayed. geom_debug() is useful at any time when one needs to check what variables are returned by a statistics. Many statistics are well documented and always return the same variables. For other statistics even if well documented the returned variables in data vary depending on grouping and/or the arguments passed to them, in which case this geometry can also be useful when debugging scripts.
Statistics that echo their data input to the R console aim at easing debugging during development of new geoms and statistics. They will also help those learning how ggplot grouping, panels and layers work.
A set of functions easy the manipulation of layers in ggplot objects, allowing deletion of any existing layer, insertion of new layers at any position, and reordering of the existing layers.
A function to drop unused variables from the data object embedded in gg and ggplot objects serves as an additional example of a manipulation that may be useful when dealing with very large datasets. Companion functions are defined to explore the embedded data.
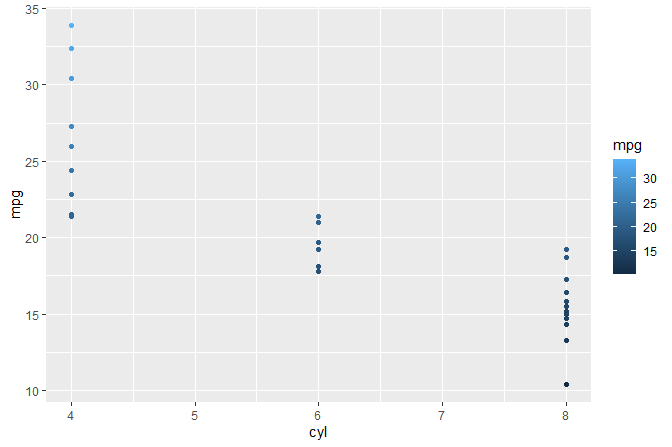
We print to the R console data as seen as input by geometries and statistics.

#> Input 'data' to 'draw_panel()':
#>    colour x    y PANEL group
#> 1 #30648F 6 21.0     1    -1
#> 2 #30648F 6 21.0     1    -1
#> 3 #356E9D 4 22.8     1    -1
#> 4 #316692 6 21.4     1    -1
#> 5 #29577E 8 18.7     1    -1
#> 6 #275379 6 18.1     1    -1
#> ...
We print to the R console colnames(data).
#> Input 'data' to 'draw_panel()':
#> [1] "colour" "x"      "y"      "PANEL"  "group"
We print to the R console data as returned by stat_summary() and seen as input by geometries.
ggplot(mtcars, aes(cyl, mpg, colour = factor(cyl))) +
  stat_summary(fun.data = "mean_cl_boot") +
  stat_summary(fun.data = "mean_cl_boot", geom = "debug")
#> Input 'data' to 'draw_panel()':
#>    colour x group        y     ymin     ymax PANEL flipped_aes
#> 1 #F8766D 4     1 26.66364 24.39977 29.25523     1       FALSE
#> 2 #00BA38 6     2 19.74286 18.82821 20.70036     1       FALSE
#> 3 #619CFF 8     3 15.10000 13.76411 16.32857     1       FALSE
We print to the R console data as seen as input by statistics that use a panel function.
ggplot(mtcars, aes(cyl, mpg, colour = factor(cyl))) +
  stat_summary(fun.data = "mean_cl_boot") +
  stat_debug_panel()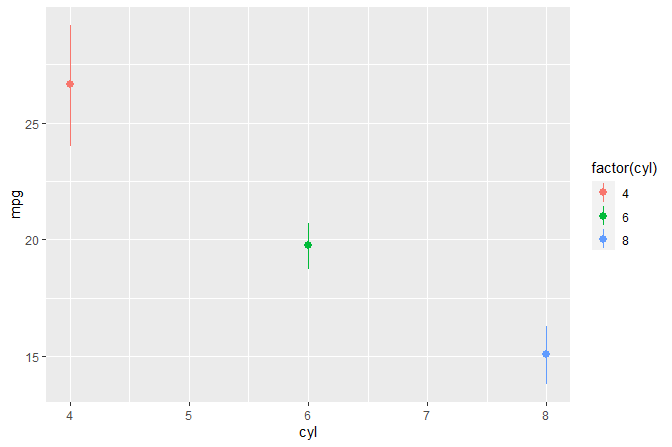
#> Input 'data' to 'compute_group()':
#> x y colour PANEL group
#> 1 6 21.0 6 1 2
#> 2 6 21.0 6 1 2
#> 3 4 22.8 4 1 1
#> 4 6 21.4 6 1 2
#> 5 8 18.7 8 1 3
#> 6 6 18.1 6 1 2
#> ...
#>
#> Input 'data' to 'draw_panel()':
#> PANEL x y nrow ncol colnames class.x class.y groups
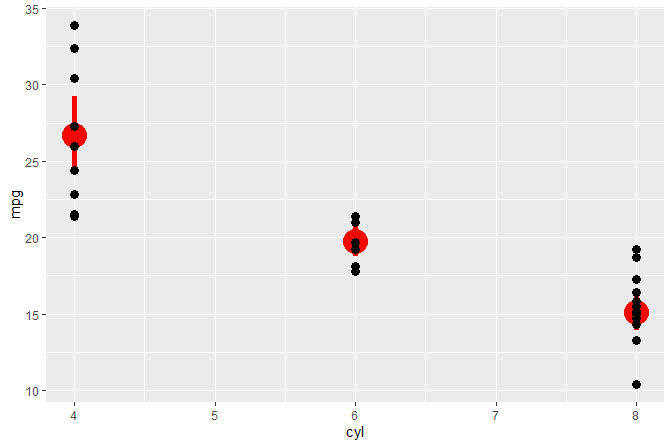
#> 1 1 6 22.15 32 5 x, y, colour, PANEL, group numeric numeric 2, 1, 3We build object p of class gg (a ggplot). We query the number of layers and the position of layers by the class of the ggproto object.
p <-
  ggplot(mtcars, aes(cyl, mpg)) +
  geom_point(size = 3) +
  stat_summary(fun.data = "mean_cl_boot", color = "red", size = 2)

  num_layers(p)
#> [1] 2
  which_layers(p, "GeomPoint")
#> [1] 1
  which_layers(p, "StatSummary")
#> [1] 2

  p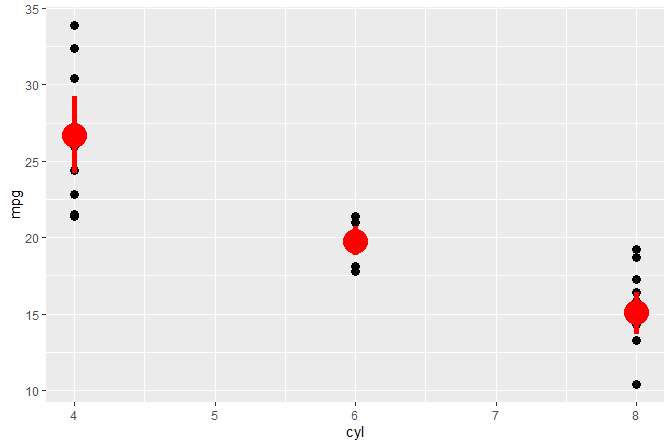
Installation of the most recent stable version from CRAN:
Installation of the current unstable version from GitHub:
HTML documentation is available at (https://docs.r4photobiology.info/gginnards/), including two vignettes.
News about updates are regularly posted at (https://www.r4photobiology.info/).
Please report bugs and request new features at (https://github.com/aphalo/gginnards/issues). Pull requests are welcome at (https://github.com/aphalo/gginnards).
If you use this package to produce scientific or commercial publications, please cite according to:
citation("gginnards")
#>
#> To cite package 'gginnards' in publications use:
#>
#>   Pedro J. Aphalo (2021). gginnards: Explore the Innards of 'ggplot2'
#>   Objects. https://www.r4photobiology.info,
#>   https://github.com/aphalo/gginnards.
#>
#> A BibTeX entry for LaTeX users is
#>
#>   @Manual{,
#>     title = {gginnards: Explore the Innards of 'ggplot2' Objects},
#>     author = {Pedro J. Aphalo},
#>     year = {2021},
#>     note = {https://www.r4photobiology.info, https://github.com/aphalo/gginnards},
#> }© 2016-2021 Pedro J. Aphalo (pedro.aphalo@helsinki.fi). Released under the GPL, version 2 or greater. This software carries no warranty of any kind.