![]()
![]()
ggpointless is an extension of the ggplot2 library
providing additional layers. The following functions are implemented in
this small package:
geom_pointless() / stat_pointless():
functions that are making it easy to add minimal emphasis to your plots
by means of a point layer.
geom_lexis() / stat_lexis(): a layer to
plot a 45° ‘lifeline’ of an event
install.packages("ggpointless")
# Or install the development version
# install.packages("devtools")
devtools::install_github("flrd/ggpointless")Once you have installed the package, simply attach it by calling:
library(ggpointless)The main functions in this package are geom_pointless()
and geom_lexis(). They work like you are used to from other
geom_* functions.
Using the functions geom_pointless(), which is a
constructor for stat_pointless(), you can highlight the
first, or last observations, sample minimum and maximum with the goal to
provide some additional context. Or just some visual sugar.
geom_pointless() behaves like geom_point()
does with the addition of a location argument. You can set
it to "first", "last" (default),
"minimum", "maximum", and "all",
where "all" is just shorthand to select
"first", "last", "minimum" and
"maximum".
cols <- c('#f4ae1b', '#d77e7b', '#a84dbd', '#311dfc')
x <- seq(-pi, pi, length.out = 500)
y <- outer(x, 1:5, function(x, y) sin(x*y))

df1 <- data.frame(
  var1 = x,
  var2 = rowSums(y)
)

ggplot(df1, aes(x = var1, y = var2)) +
  geom_line() +
  geom_pointless(aes(color = after_stat(location)),
                 location = "all",
                 size = 3) +
  scale_color_manual(values = cols) +
  theme_minimal()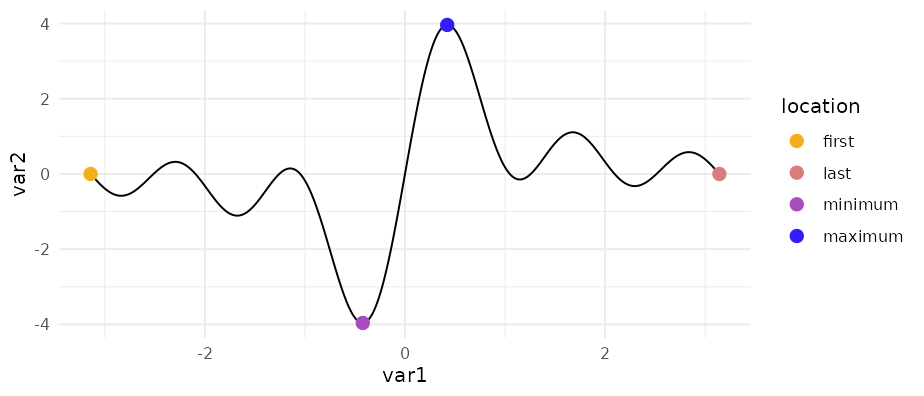
geom_lexis() is a combination of a segment and a point
layer. Given a start value and an end value, this geom draws a 45° line
which indicates the duration of an event. Required are x
and xend aesthetics, y and yend
coordinates will be calculated for you.
df2 <- data.frame(
  key = c("A", "B", "B", "C", "D"),
  x = c(0, 1, 6, 5, 6),
  xend = c(5, 4, 10, 8, 10)
)

ggplot(df2, aes(x = x, xend = xend, color = key)) +
  geom_lexis(aes(linetype = after_stat(type)), size = .5, point_size = 3) +
  coord_equal() +
  scale_x_continuous(breaks = c(df2$x, df2$xend)) +
  scale_color_manual(values = cols) +
  scale_linetype_identity() +
  theme_minimal() +
  theme(panel.grid.minor = element_blank())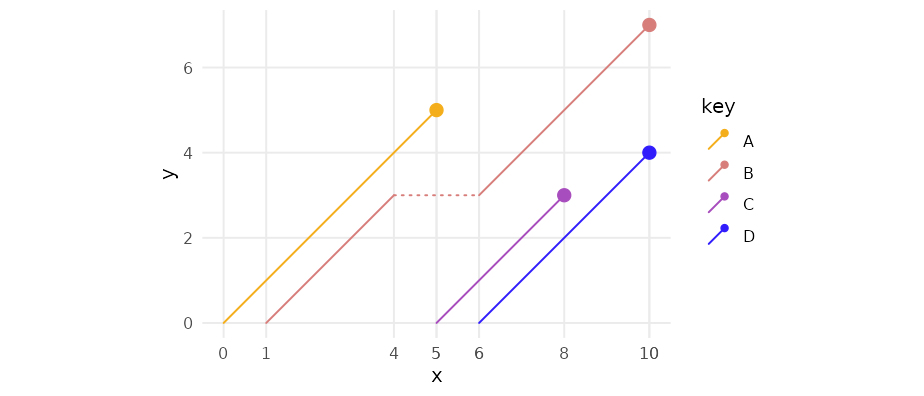
See the vignette("ggpointless")
for more details.
The ggpointless package contains the following data
sets:
co2_ml : CO2 records
taken at Mauna Loacovid_vac : COVID-19
Cases and Deaths by Vaccination Statusfemale_leaders : Elected
and appointed female heads of state and governmentSee the vignette("examples")
for possible use cases.
Please note that this project is released with a Contributor Code of Conduct. By participating in this project you agree to abide by its terms.