![]()
Package ‘ggpp’ provides a set of building blocks that extend the Grammar of Graphics implemented in package ‘ggplot2’ (>= 3.0.0). New “geoms” support insets in plots, marginal marks and the use of native plot coordinates (npc). Position functions implement new approaches to nudging usable with any geometry, but especially useful together with geom_text_s(), ggrepel::geom_text_repel() and ggrepel::geom_label_repel().
Geometries geom_table(), geom_plot() and geom_grob() make it possible to add inset tables, inset plots, and arbitrary ‘grid’ graphical objects including bitmaps and vector graphics as layers to a ggplot using native coordinates for x and y.
Geometries geom_text_npc(), geom_label_npc(), geom_table_npc(), geom_plot_npc() and geom_grob_npc(), geom_text_npc() and geom_label_npc() are versions of geometries that accept positions on x and y axes using aesthetics npcx and npcy values expressed in “npc” units.
Geometries geom_x_margin_arrow(), geom_y_margin_arrow(), geom_x_margin_grob(), geom_y_margin_grob(), geom_x_margin_point() and geom_y_margin_point() make it possible to add marks along the x and y axes. geom_vhlines() and geom_quadrant_lines() draw vertical and horizontal reference lines within a single layer.
Geometries geom_text_s(), geom_label_s(), geom_point_s(), geom_table(), geom_plot() and geom_grob() connect (by default) the plot elements added at a nudged position to the original position with a segment or arrow.
Scales scale_npcx_continuous() and scale_npcy_continuous() and the corresponding new aesthetics npcx and npcy make it possible to add graphic elements and text to plots using coordinates expressed in npc units for the location within the plotting area.
Statistic stat_fmt_tb() helps with the formatting of tables to be plotted with geom_table().
Four statistics, stat_dens2d_filter(), stat_dens2d_label(), stat_dens1d_filter() and stat_dens1d_label(), implement tagging or selective labelling of observations based on the local 2D density of observations in a panel. Another two statistics, stat_dens1d_filter_g() and stat_dens1d_filter_g() compute the density by group instead of by plot panel. These six statistics are designed to work well together with geom_text_repel() and geom_label_repel() from package ‘ggrepel’.
The statistics stat_apply_panel() and stat_apply_group() are useful for applying arbitrary functions returning numeric vectors like cumsum(), cummax() and diff(). Statistics stat_centroid() and stat_summary_xy() allow computation of summaries on both x and y and passing them to a geom.
Position functions implementing different flavours of nudging are provided: position_nudge_keep(), position_nudge_to(), position_nudge_center() and position_nudge_line(). These last two functions make it possible to apply nudging that varies automatically according to the relative position of points with respect to arbitrary points or lines, or with respect to a polynomial or smoothing spline fitted on-the-fly to the the observations.
Position functions position_stacknudge(), position_fillnudge(), position_jitternudge(), position_dodgenudge() and position_dodge2nudge() each combines the roles of two position functions. They make it possible to easily nudge labels in plot layers that use stacking, dodging or jitter. Functions position_jitter_keep(), position_stack_keep(), position_fill_keep(), position_dodge_keep(), position_dosge2_keep() behave like the positions from ‘ggplot2’ but keep in data the original coordinates.
In contrast to position functions from ‘ggplot2’ all these position functions keep the original x and y coordinates when displacing them. This makes them compatible with the repulsive geometries from package ‘ggrepel’ (>= 0.9.1) as well as with geom_text_s(), geom_point_s(), geom_table(), geom_plot() and geom_grob() from this package. All these geoms can draw segments or arrows connecting the original positions to the displaced positions. They remain backwards compatible and can be used in all geometries that have a position formal parameter.
Justifications "outward_mean", "inward_mean", "outward_median" and "inward_median" implementing outward and inward justification relative to the centroid of the data instead of to the center of the x or y scales. Justification outward or inward from an arbitrary origin is also supported.
This package is a “spin-off” from package ‘ggpmisc’ containing extensions to the grammar originally written for use wihtin ‘ggpmisc’. As ‘ggpmisc’ had grown in size, splitting it into two packages was necessary to easy development and maintenance and to facilitate imports into other packages. For the time being, package ‘ggpmisc’ imports and re-exports all visible definitions from ‘ggpp’.
The plots below exemplify some of the things that ‘ggpp’ makes possible or makes easier to code compared to ‘ggplot’ used by itself. Additional examples including several combining ‘ggpp’ and ‘ggrepel’ are provided in the package vignette.
A plot with an inset table.
mtcars %>%
  group_by(cyl) %>%
  summarize(wt = mean(wt), mpg = mean(mpg)) %>%
  ungroup() %>%
  mutate(wt = sprintf("%.2f", wt),
         mpg = sprintf("%.1f", mpg)) -> tb

df <- tibble(x = 5.45, y = 34, tb = list(tb))

ggplot(mtcars, aes(wt, mpg, colour = factor(cyl))) +
  geom_point() +
  geom_table(data = df, aes(x = x, y = y, label = tb))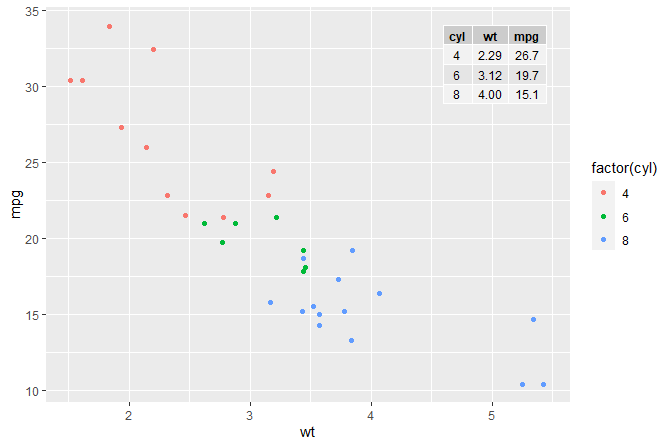
A plot with an inset plot.
Inset plot positioned using native plot coordinates (npc) and using keywords insted of numerical values in the range 0..1 which are also accepted.
p <- ggplot(mtcars, aes(factor(cyl), mpg, colour = factor(cyl))) +
  stat_boxplot() +
  labs(y = NULL, x = "Engine cylinders (number)") +
  theme_bw(9) + theme(legend.position = "none")

ggplot(mtcars, aes(wt, mpg, colour = factor(cyl))) +
  geom_point(show.legend = FALSE) +
  annotate("plot_npc", npcx = "left", npcy = "bottom", label = p) +
  expand_limits(y = 0, x = 0)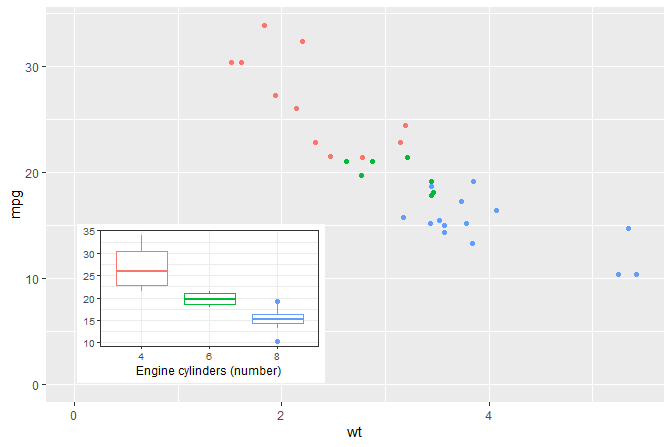
Means computed on-the-fly and shown as asterisks.
ggplot(mtcars, aes(wt, mpg, colour = factor(cyl))) +
  geom_point() +
  stat_centroid(shape = "asterisk", size = 6)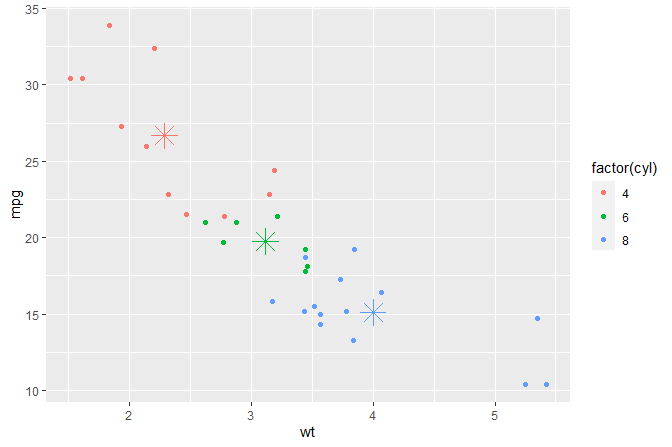
Medians computed on-the-fly displayed marginal arrows.
ggplot(mtcars, aes(wt, mpg, colour = factor(cyl))) +
  geom_point() +
  stat_centroid(geom = "y_margin_arrow", .fun = median,
                aes(yintercept = after_stat(y)), arrow.length = 0.05)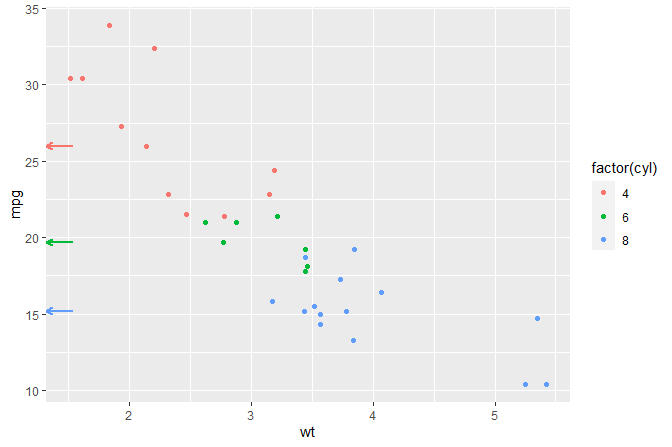
df <- data.frame(x1 = c(1, 2, 1, 3, -1),
                 x2 = c("a", "a", "b", "b", "b"),
                 grp = c("some long name", "other name", "some name",
                         "another name", "a name"))

# Add labels to a horizontal column plot (stacked by default)
ggplot(data = df, aes(x2, x1, group = grp)) +
  geom_col(aes(fill = grp), width=0.5) +
  geom_hline(yintercept = 0) +
  geom_text(
    aes(label = grp),
    position = position_stacknudge(vjust = 1, y = -0.2)) +
  theme(legend.position = "none")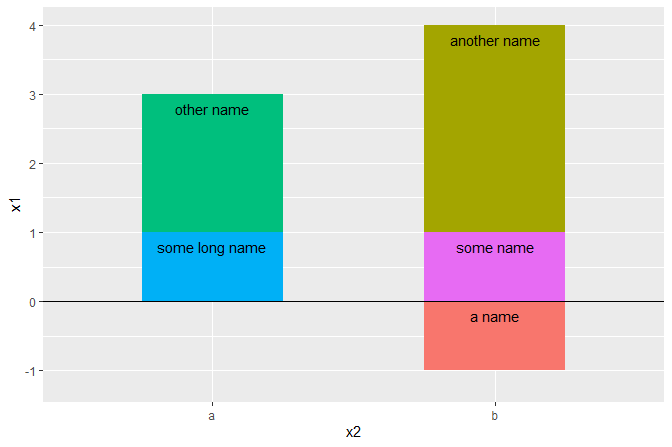
Installation of the most recent stable version from CRAN:
Installation of the current unstable version from GitHub:
HTML documentation for the package, including help pages and the User Guide, is available at (https://docs.r4photobiology.info/ggpp/).
News about updates are regularly posted at (https://www.r4photobiology.info/).
Chapter 7 in Aphalo (2020) explains both basic concepts of the gramamr of graphics as implemented in ‘ggplot2’ as well as extensions to this grammar including several of those made available by packages ‘ggpp’ and ‘ggpmisc’.
Please report bugs and request new features at (https://github.com/aphalo/ggpp/issues). Pull requests are welcome at (https://github.com/aphalo/ggpp).
If you use this package to produce scientific or commercial publications, please cite according to:
Aphalo, Pedro J. (2020) Learn R: As a Language. The R Series. Boca Raton and London: Chapman and Hall/CRC Press. ISBN: 978-0-367-18253-3. 350 pp.
© 2016-2021 Pedro J. Aphalo (pedro.aphalo@helsinki.fi). Released under the GPL, version 2 or greater. This software carries no warranty of any kind.