![]()
![]()
The goal of makepipe is to allow for the construction of
make-like pipelines in R with very minimal overheads. In contrast to
targets (and its predecessor drake) which
offers an opinionated pipeline framework that demands highly
functionalised code, makepipe is easy-going, being
adaptable to a wide range of data science workflows.
A minimal example can be found here: https://github.com/kinto-b/makepipe_example
You can install the released version of makepipe from CRAN with:
install.packages("makepipe")And the development version from GitHub with:
# install.packages("devtools")
devtools::install_github("kinto-b/makepipe")To construct a pipeline, one simply needs to chain together a number
of make_with_*() statements. When the pipeline is run
through, each make_with_*() block is evaluated if and only
if the targets are out-of-date with respect to the
dependencies (and source file). But, whether
or not the block is evaluated, a segment will be added to the Pipeline
object behind the scenes. At the end of the script, once the entire
pipeline has been run through, one can display the accumulated Pipeline
object to produce a flow-chart visualisation of the pipeline. For
example:
make_with_source(
  note = "Clean raw survey data and do derivations",
  source = "one.R",
  targets = "data/1 data.Rds",
  dependencies = c("data/raw.Rds", "lookup/concordance.csv")
)

make_with_recipe(
  label = "Merge it!",
  note = "Merge demographic variables from population data into survey data",
  recipe = {
    dat <- readRDS("data/1 data.Rds")
    pop <- readRDS("data/pop.Rds")
    merged_dat <- merge(dat, pop, by = "id")
    saveRDS(merged_dat, "data/2_data.Rds")
  },
  targets = c("data/2 data.Rds"),
  dependencies = c("data/1 data.Rds", "data/pop.Rds")
)

make_with_source(
  note = "Convert data from 'wide' to 'long' format",
  source = "three.R",
  targets = "data/3 data.Rds",
  dependencies = "data/2 data.Rds"
)

show_pipeline()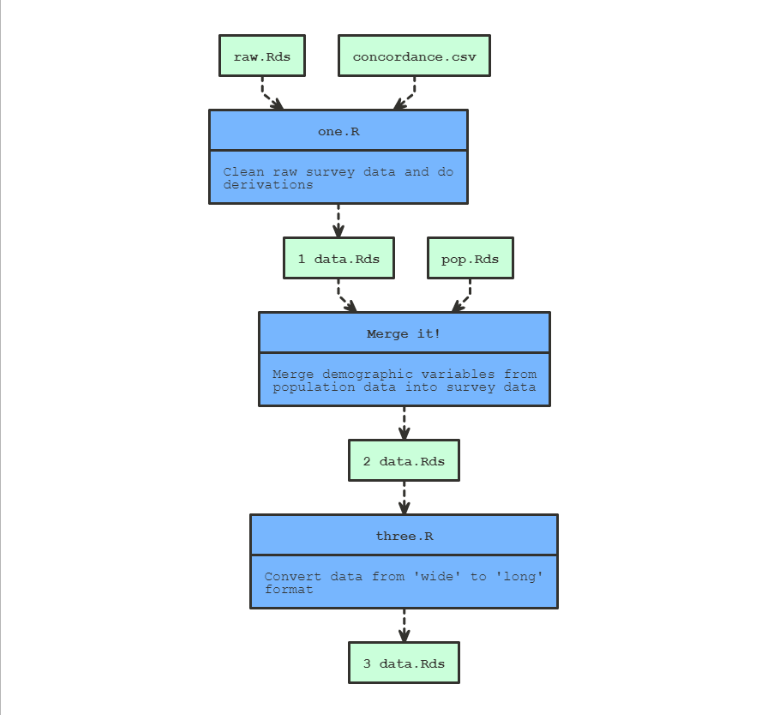
We can also get an interactive visNetwork widget:
show_pipeline(as = "visnetwork")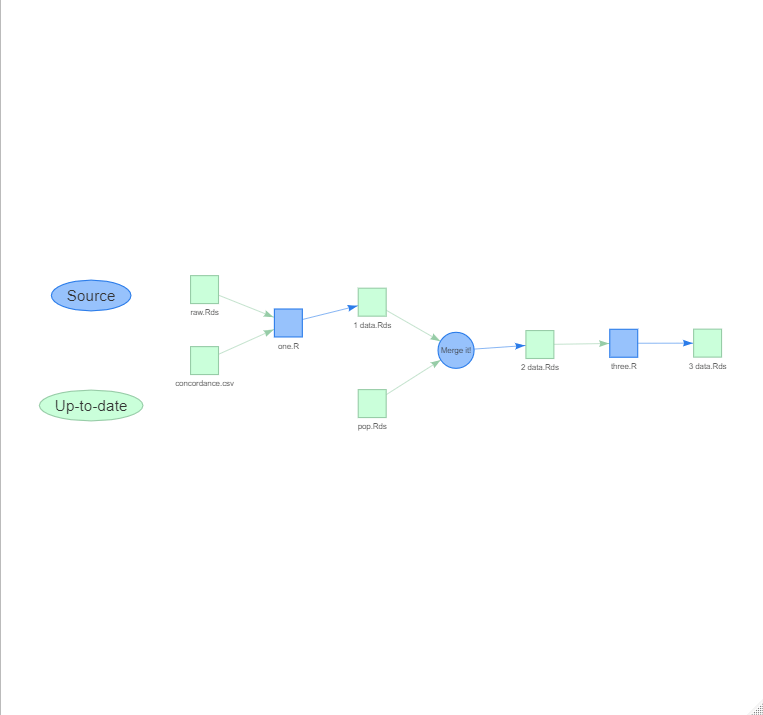
Once you’ve constructed a pipeline, you can ‘clean’ it (i.e. delete all registered targets):
p <- get_pipeline()
p$clean()
Then, when you look again at the visualisation, the target nodes will be red not green since they’re out-of-date:
show_pipeline()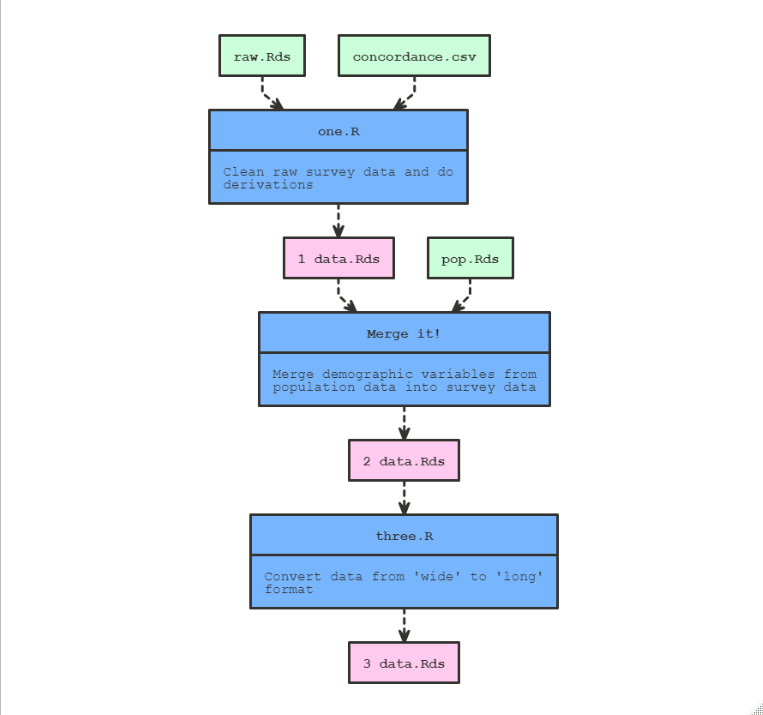
And then you can ‘rebuild’ to re-execute the entire pipeline and re-create the cleaned targets:
p <- get_pipeline()
p$build()