![]()
WARNING: Due to a change in the Our World in Data Website, your version of owidR may not work. A new version has been uploaded to CRAN, please update the package.
This package acts as an interface to Our World in Data datasets, allowing for an easy way to search through data used in over 3,000 charts and load them into the R environment.
To install from CRAN:
install.packages("owidR")To install the development version from GitHub:
devtools::install_github("piersyork/owidR")The main function in owidR is owid(), which takes a
chart id and returns a tibble (dataframe) of the corresponding OWID
dataset. To search for chart ids you can use owid_search()
to list all the chart ids that match a keyword or regular
expression.
Lets use the core functions to get data on how human rights have changed over time. First by searching for charts on human rights.
library(owidR)

owid_search("human rights")
##      titles
## [1,] "Human rights protection vs. liberal democracy"
## [2,] "Countries with National Human Rights Institutions in compliance with the Paris Principles"
## [3,] "Human rights protection"
## [4,] "Human rights protection vs. GDP per capita"
## [5,] "Proportion of countries that applied for accreditation as independent National Human Rights Institutions in compliance with Paris Principles"
##      chart_id
## [1,] "human-rights-protection-vs-liberal-democracy"
## [2,] "countries-in-compliance-with-paris-principles"
## [3,] "human-rights-protection"
## [4,] "human-rights-protection-vs-gdp-per-capita"
## [5,] "countries-that-applied-for-accreditation-in-paris-principles"
Let’s use the human rights scores dataset.
rights <- owid("human-rights-scores")

rights
## # A tibble: 11,273 × 4
##    entity      code   year `Human rights protection`
##  * <chr>       <chr> <int>                     <dbl>
##  1 Afghanistan AFG    1946                     0.829
##  2 Afghanistan AFG    1947                     0.878
##  3 Afghanistan AFG    1948                     0.935
##  4 Afghanistan AFG    1949                     0.966
##  5 Afghanistan AFG    1950                     1.01
##  6 Afghanistan AFG    1951                     1.09
##  7 Afghanistan AFG    1952                     1.13
##  8 Afghanistan AFG    1953                     1.18
##  9 Afghanistan AFG    1954                     1.22
## 10 Afghanistan AFG    1955                     1.22
## # … with 11,263 more rows
## # ℹ Use `print(n = ...)` to see more rows
owid_plot() makes it easy to visualise an owid dataset,
plotting the first value column of an owid dataset. By default the mean
score across all countries is plotted.
owid_plot(rights)
Use summarise = FALSE to show individual countries
instead of the mean score. Unless a vector of entities is specified
using the filter argument 9 random entities will be
plotted. If the data is not a time-series then a bar chart of the
entities values will be plotted.
owid_plot(rights, summarise = FALSE, filter = c("North Korea", "South Korea", "France", "United Kingdom", "United States"))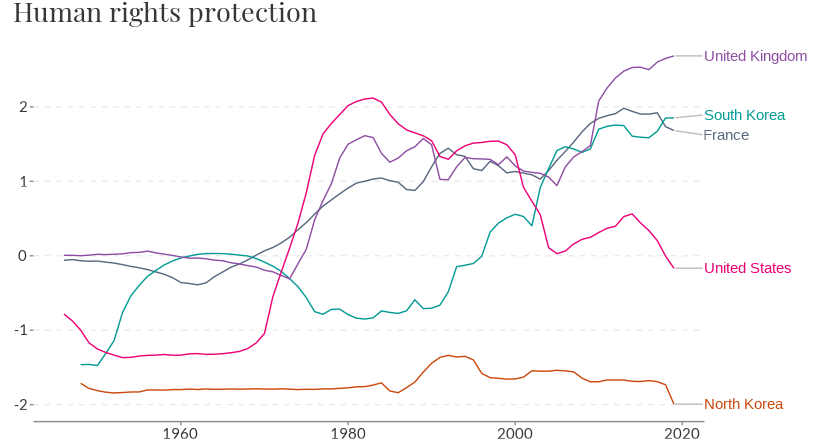
owid_map() makes it easy to create a choropleth world
map of datasets that contain country level data. The Entities of the
owid data must be country names. By default the most recent year will be
plotted, use the year argument to plot a different
year.
owid_map(rights)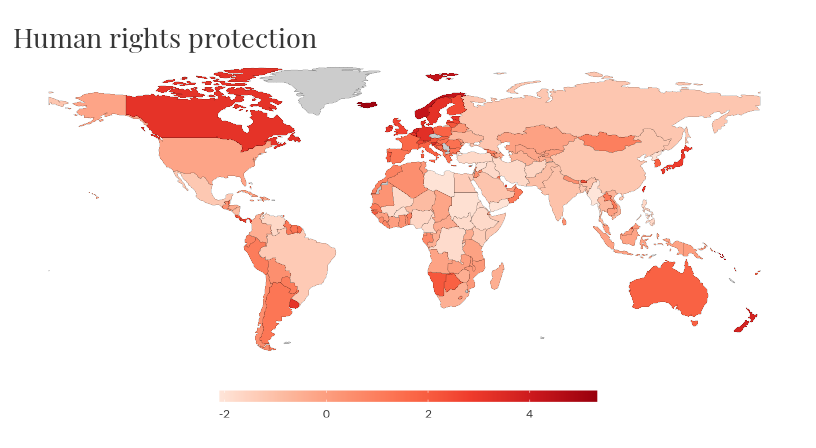
You can quickly download world covid-19 data, including vaccination
rates, using owid_covid().
covid <- owid_covid()

covid
## # A tibble: 206,844 × 67
##    iso_code continent locat…¹ date       total…² new_c…³ new_c…⁴ total…⁵ new_d…⁶
##    <chr>    <chr>     <chr>   <date>       <dbl>   <dbl>   <dbl>   <dbl>   <dbl>
##  1 AFG      Asia      Afghan… 2020-02-24       5       5  NA          NA      NA
##  2 AFG      Asia      Afghan… 2020-02-25       5       0  NA          NA      NA
##  3 AFG      Asia      Afghan… 2020-02-26       5       0  NA          NA      NA
##  4 AFG      Asia      Afghan… 2020-02-27       5       0  NA          NA      NA
##  5 AFG      Asia      Afghan… 2020-02-28       5       0  NA          NA      NA
##  6 AFG      Asia      Afghan… 2020-02-29       5       0   0.714      NA      NA
##  7 AFG      Asia      Afghan… 2020-03-01       5       0   0.714      NA      NA
##  8 AFG      Asia      Afghan… 2020-03-02       5       0   0          NA      NA
##  9 AFG      Asia      Afghan… 2020-03-03       5       0   0          NA      NA
## 10 AFG      Asia      Afghan… 2020-03-04       5       0   0          NA      NA
## # … with 206,834 more rows, 58 more variables: new_deaths_smoothed <dbl>,
## #   total_cases_per_million <dbl>, new_cases_per_million <dbl>,
## #   new_cases_smoothed_per_million <dbl>, total_deaths_per_million <dbl>,
## #   new_deaths_per_million <dbl>, new_deaths_smoothed_per_million <dbl>,
## #   reproduction_rate <dbl>, icu_patients <dbl>,
## #   icu_patients_per_million <dbl>, hosp_patients <dbl>,
## #   hosp_patients_per_million <dbl>, weekly_icu_admissions <dbl>, …
## # ℹ Use `print(n = ...)` to see more rows, and `colnames()` to see all variable names