paleobioDB is a package for downloading, visualizing and processing data from Paleobiology Database.
Install
Install paleobioDB from CRAN
Install paleobioDB developing version from github
install.packages("devtools")
library(devtools)
install_github("ropensci/paleobioDB")
library(paleobioDB)
General overview
paleobioDB version 0.5 has 19 functions to wrap each endpoint of the PaleobioDB API, plus 8 functions to visualize and process the fossil data. The API documentation for the Paleobiology Database can be found here.
pbdb_occurrences
e.g., to download all the fossil data that belongs to the family Canidae, set base_name = “Canidae”.
> canidae<-  pbdb_occurrences (limit="all",
                             base_name="canidae", vocab="pbdb",
                             interval="Quaternary",
                             show=c("coords", "phylo", "ident"))
head(canidae)
## occurrence_no record_type collection_no taxon_name taxon_rank taxon_no
## 150070 occurrence 13293 Cuon sp. genus 41204
## 186572 occurrence 18320 Canis cf. sp. genus 41198
## 186573 occurrence 18320 Vulpes sp. genus 41248
## 186574 occurrence 18320 Borophagus sp. genus 41196
## 192926 occurrence 19617 Canis edwardii species 44838
## 192927 occurrence 19617 Canis armbrusteri cf. species 44827
## matched_rank early_interval late_interval early_age late_age reference_no
## 5 Middle Pleistocene Late Pleistocene 0.81 0.0117 4412
## 5 Late Hemphillian Blancan 10.300 1.8000 6086
## 5 Late Hemphillian Blancan 10.300 1.8000 6086
## 5 Late Hemphillian Blancan 10.300 1.8000 6086
## 3 Blancan Irvingtonian 4.900 0.3000 2673
## 3 Blancan Irvingtonian 4.900 0.3000 2673
## lng lat family family_no order order_no class class_no phylum
## 111.56667 22.76667 Canidae 41189 Carnivora 36905 Mammalia 36651 Chordata
## -85.79195 40.45444 Canidae 41189 Carnivora 36905 Mammalia 36651 Chordata
## -85.79195 40.45444 Canidae 41189 Carnivora 36905 Mammalia 36651 Chordata
## -85.79195 40.45444 Canidae 41189 Carnivora 36905 Mammalia 36651 Chordata
## -112.40000 35.70000 Canidae 41189 Carnivora 36905 Mammalia 36651 Chordata
## -112.40000 35.70000 Canidae 41189 Carnivora 36905 Mammalia 36651 Chordata
## phylum_no genus_name species_name genus_reso reid_no species_reso matched_name
## 33815 Cuon sp. <NA> NA <NA> <NA>
## 33815 Canis sp. cf. NA <NA> <NA>
## 33815 Vulpes sp. <NA> NA <NA> <NA>
## 33815 Borophagus sp. <NA> NA <NA> <NA>
## 33815 Canis edwardii <NA> 8376 <NA> <NA>
## 33815 Canis armbrusteri <NA> 8377 cf. <NA>
## subgenus_name subgenus_reso
## <NA> <NA>
## <NA> <NA>
## <NA> <NA>
## <NA> <NA>
## <NA> <NA>
## <NA> <NA>CAUTION WITH THE RAW DATA
Beware of synonyms and errors, they could twist your estimations about species richness, evolutionary and extinction rates, etc. paleobioDB users should be critical about the raw data downloaded from the database and filter the data before analyzing it.
For instance, when using “base_name” for downloading the information with the function pbdb_occurrences, check out the synonyms and errors that could appear in “taxon_name”, “genus_name”, etc. In our example, in canidae$genus_name there are errors: “Canidae” and “Caninae” appeared as genus names. If not eliminated, they will increase the richness of genera.
pbdb_map
Returns a map with the species occurrences.
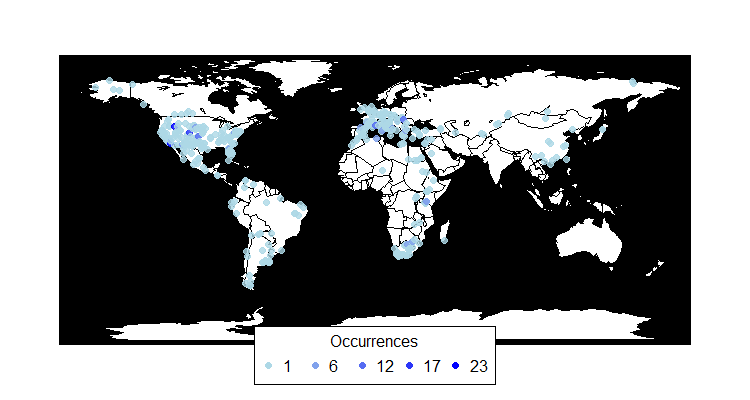
pbdb_map_occur Returns a map and a raster object with the sampling effort (number of fossil records per cell).
## class       : RasterLayer
## dimensions  : 34, 74, 2516  (nrow, ncol, ncell)
## resolution  : 5, 5  (x, y)
## extent      : -179.9572, 190.0428, -86.42609, 83.57391  (xmin, ## xmax, ymin, ymax)
## coord. ref. : NA
## data source : in memory
## names       : layer
## values      : 1, 40  (min, max)
pbdb_map_richness Returns a map and a raster object with the number of different species, genera, family, etc. per cell. The user can change the resolution of the cells.
## class       : RasterLayer
## dimensions  : 34, 74, 2516  (nrow, ncol, ncell)
## resolution  : 5, 5  (x, y)
## extent      : -179.9572, 190.0428, -86.42609, 83.57391  (xmin, xmax, ymin, ymax)
## coord. ref. : NA
## data source : in memory
## names       : layer
## values      : 1, 12  (min, max)
pbdb_temporal_range
Returns a dataframe and a plot with the time span of the species, genera, families, etc. in your query.
                           max    min
## Canis brevirostris        5.3330 0.0000
## Canis mesomelas           5.3330 0.
## Alopex praeglacialis      5.3330 0.0117
## Nyctereutes megamastoides 5.3330 0.0117
## Vulpes atlantica          5.3330 0.0117
## Canis latrans             4.9000 0.0000
...
pbdb_richness
Returns a dataframe and a plot with the number of species (or genera, families, etc.) across time. You should set the temporal extent and the temporal resolution for the steps.
## labels2 richness
## <=1       23
## 1-2       56
## 2-3       53
## 3-4       19
## 4-5       18
## 5-6        5
## 6-7        0
## 7-8        0
## 8-9        0
## 9-10       0
## >10        0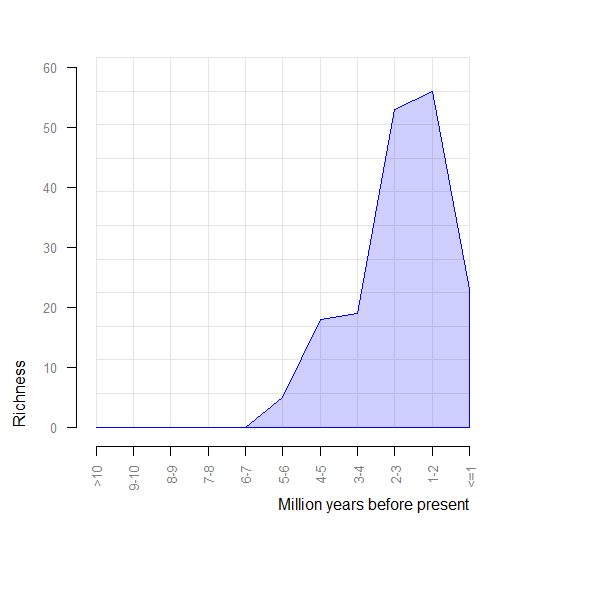
pbdb_orig_ext
Returns a dataframe and a plot with the number of new appearances and last appearances of species, genera, families, etc. in your query across the time. You should set the temporal extent and the resolution of the steps.
# evolutionary rates= orig_ext=1
> pbdb_orig_ext (canidae, rank="species", orig_ext=1, temporal_extent=c(0,10), res=1)
## new ext
## 1-2 to 0-1 0 28
## 2-3 to 1-2 34 6
## 3-4 to 2-3 1 0
## 4-5 to 3-4 13 0
## 5-6 to 4-5 5 0
## 6-7 to 5-6 0 0
## 7-8 to 6-7 0 0
## 8-9 to 7-8 0 0
## 9-10 to 8-9 0 0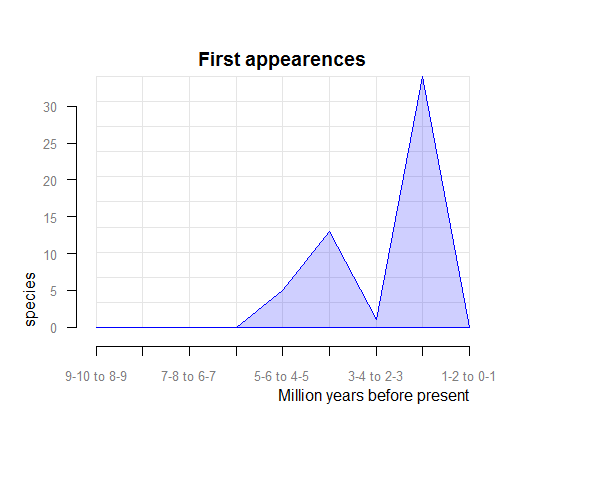
# extinction rates= orig_ext=2
pbdb_orig_ext(canidae, rank="species", orig_ext=2, temporal_extent=c(0,10), res=1)
## new ext
## 1-2 to 0-1 0 28
## 2-3 to 1-2 34 6
## 3-4 to 2-3 1 0
## 4-5 to 3-4 13 0
## 5-6 to 4-5 5 0
## 6-7 to 5-6 0 0
## 7-8 to 6-7 0 0
## 8-9 to 7-8 0 0
## 9-10 to 8-9 0 0
pbdb_subtaxa
Returns a plot and a dataframe with the number of species, genera, families, etc. in your dataset.
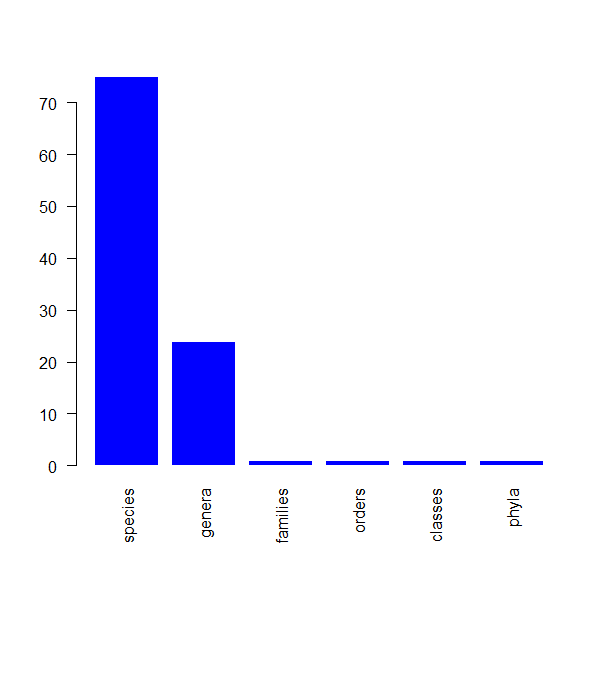
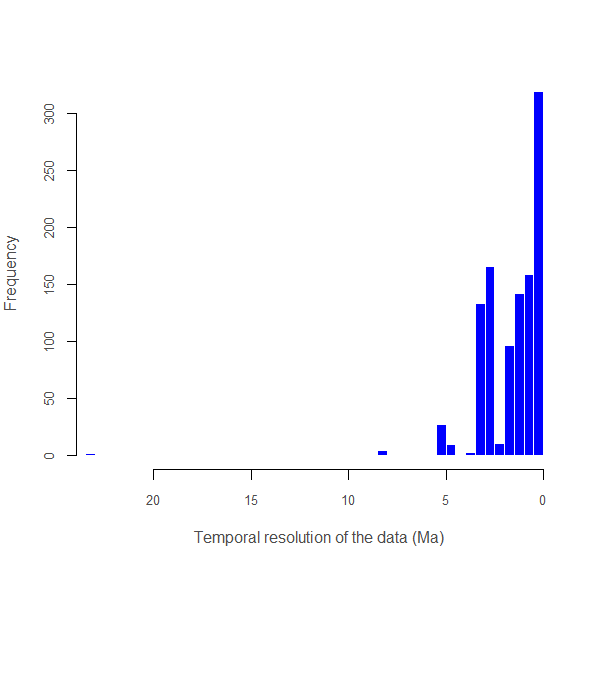
pbdb_temporal_resolution
Returns a plot and a dataframe with a main summary of the temporal resolution of the fossil records
## $summary
## Min. 1st Qu.  Median    Mean 3rd Qu.    Max.
## 0.0117  0.1143  1.5000  1.5360  2.5760 23.0200
##
## $temporal_resolution
## [1]  0.7693  8.5000  8.5000  8.5000  4.6000
## [6]  4.6000  4.6000  3.1000  3.1000  3.1000
## [11]  3.1000  4.6000  3.1000  3.1000  3.1000
## [16]  3.1000  3.1000  3.1000  3.1000  3.1000
## [21]  3.1000  3.1000  3.1000  3.1000  3.1000
## [26]  3.1000  3.1000  3.1000  3.1000  3.1000
...
We are including a Dockerfile to ease working on the package as it fulfills all the system dependencies of the package.
How to load the package with Docker:
This command will create a docker image in your system based on some of the rocker/tidyverse images. You can see the new image with docker images ls. 3. Start a container for this image. Type the following command picking some
This will start a container with access to your current folder where all the code of the package is. Inside the container, the code will be located in /home/rstudio. It also exposes the port 8787 of the container so you may access to the RStudio web application which is bundled in the rocker base image. 4. Navigate to http://localhost:8787. Enter with user=rstudio and the password you used in the command above. 5. You may enter to the container via console with:
docker exec -ti ravis bashEither from RStudio or from within the container you can install the package out of the code with:
cd /home/rstudio
R
library(devtools)
install.packages(".", repos=NULL, type = "source")

## Meta

Please report any [issues or bugs](https://github.com/ropensci/pbdb/issues).

License: GPL-2

To cite package `paleobioDB` in publications use:

```coffee
To cite package `paleobioDB` in publications use:

Sara Varela, Javier Gonzalez-Hernandez and Luciano Fabris Sgarbi (2016). paleobioDB: an R-package for downloading, visualizing and processing data from the Paleobiology Database. R package version 0.5. https://github.com/ropensci/paleobioDB

A BibTeX entry for LaTeX users is

  @Manual{,
    title = {paleobioDB: an R-package for downloading, visualizing and processing data from the Paleobiology Database},
    author = {{Sara Varela} and {Javier Gonzalez-Hernandez} and {Luciano Fabris Sgarbi}},
    year = {2014},
    note = {R package version 0.7},
    base = {https://github.com/ropensci/paleobioDB},
  }
This package is part of the rOpenSci project.