
An R package for estimating expected blood pressure of children and adolescences
![]()
![]()
![]()
![]()
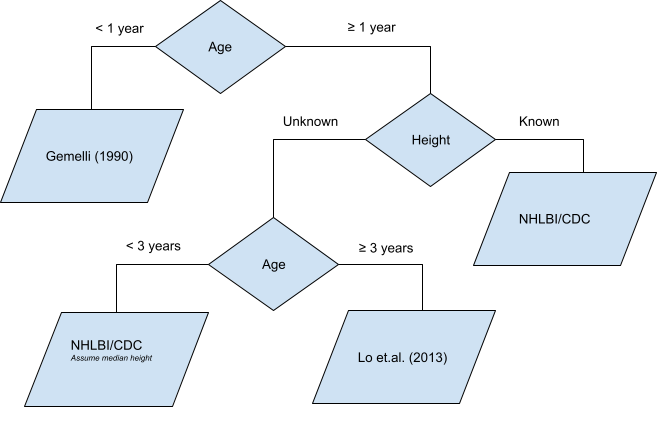
Provide a method for translating pediatric blood pressures, dependent on age, sex, and height (if known), to percentiles.
Blood pressure percentiles are based on Gaussian distributions defined by published values for the mean and standard deviation, or derived mean and standard deviations based on published percentiles.
Install the developmental version:
remotes::install_github("dewittpe/pedbp", dependencies = TRUE)Inputs for these functions are:
d <- read.csv(system.file("example_data", "for_batch.csv", package = "pedbp"))
d
## pid age_months male height..cm. sbp..mmHg. dbp..mmHg.
## 1 patient_A 96 1 NA 102 58
## 2 patient_B 144 0 153 113 NA
## 3 patient_C 4 0 62 82 43
## 4 patient_D_1 41 1 NA 96 62
## 5 patient_D_2 41 1 101 96 62# distribution function
p_bp( q_sbp = d$sbp..mmHg.
, q_dbp = d$dbp..mmHg.
, age = d$age_months
, male = d$male
, height = d$height..cm.
)## $sbp_percentile
## [1] 0.5533069 0.7680548 0.2622697 0.6195685 0.6101926
##
## $dbp_percentile
## [1] 0.4120704 NA 0.1356661 0.8028518 0.9011263# quantile function
q_bp( p_sbp = 0.50
, p_dbp = 0.40
, age = 96
, male = 1)## $sbp
## [1] 100.7
##
## $dbp
## [1] 57.74789Plots show where an observed blood pressure is on the distribution curve
bp_cdf(  sbp = 105
       , dbp = 59
       , age   = 96
       , male  = 1)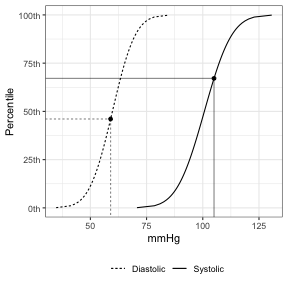
More examples and details for the blood pressure distribution functions, along with additional features such as CDC growth charts, can be found in the package vignette.
vignette("bp-distributions", package = "pedbp")An interactive Shiny application is also available. After installing the pedbp package and the suggested packages, you can run the app locally via
shiny::runApp(system.file("shinyapps", "pedbp", package = "pedbp"))Expert Panel On Integrated Guidelines For Cardiovascular Health and Risk Reduction in Children and Adolescents. 2011. “Expert Panel on Integrated Guidelines for Cardiovascular Health and Risk Reduction in Children and Adolescents: Summary Report.” Pediatrics 128 (Supplement_5): S213–56. https://doi.org/10.1542/peds.2009-2107C.
Gemelli, M, R Manganaro, C Mami, and F De Luca. 1990. “Longitudinal Study of Blood Pressure During the 1st Year of Life.” European Journal of Pediatrics 149 (5): 318–20.
Lo, Joan C, Alan Sinaiko, Malini Chandra, Matthew F Daley, Louise C Greenspan, Emily D Parker, Elyse O Kharbanda, et.al. 2013. “Prehypertension and Hypertension in Community-Based Pediatric Practice.” Pediatrics 131 (2): e415–24.
Martin, Blake, Peter E. DeWitt, Scout HF, SK Parker, and Tellen D. Bennett. 2022. “Machine Learning Approach to Predicting Absence of Serious Bacterial Infection at PICU Admission.” Hospital Pediatrics.