![]()


![]()
![]()
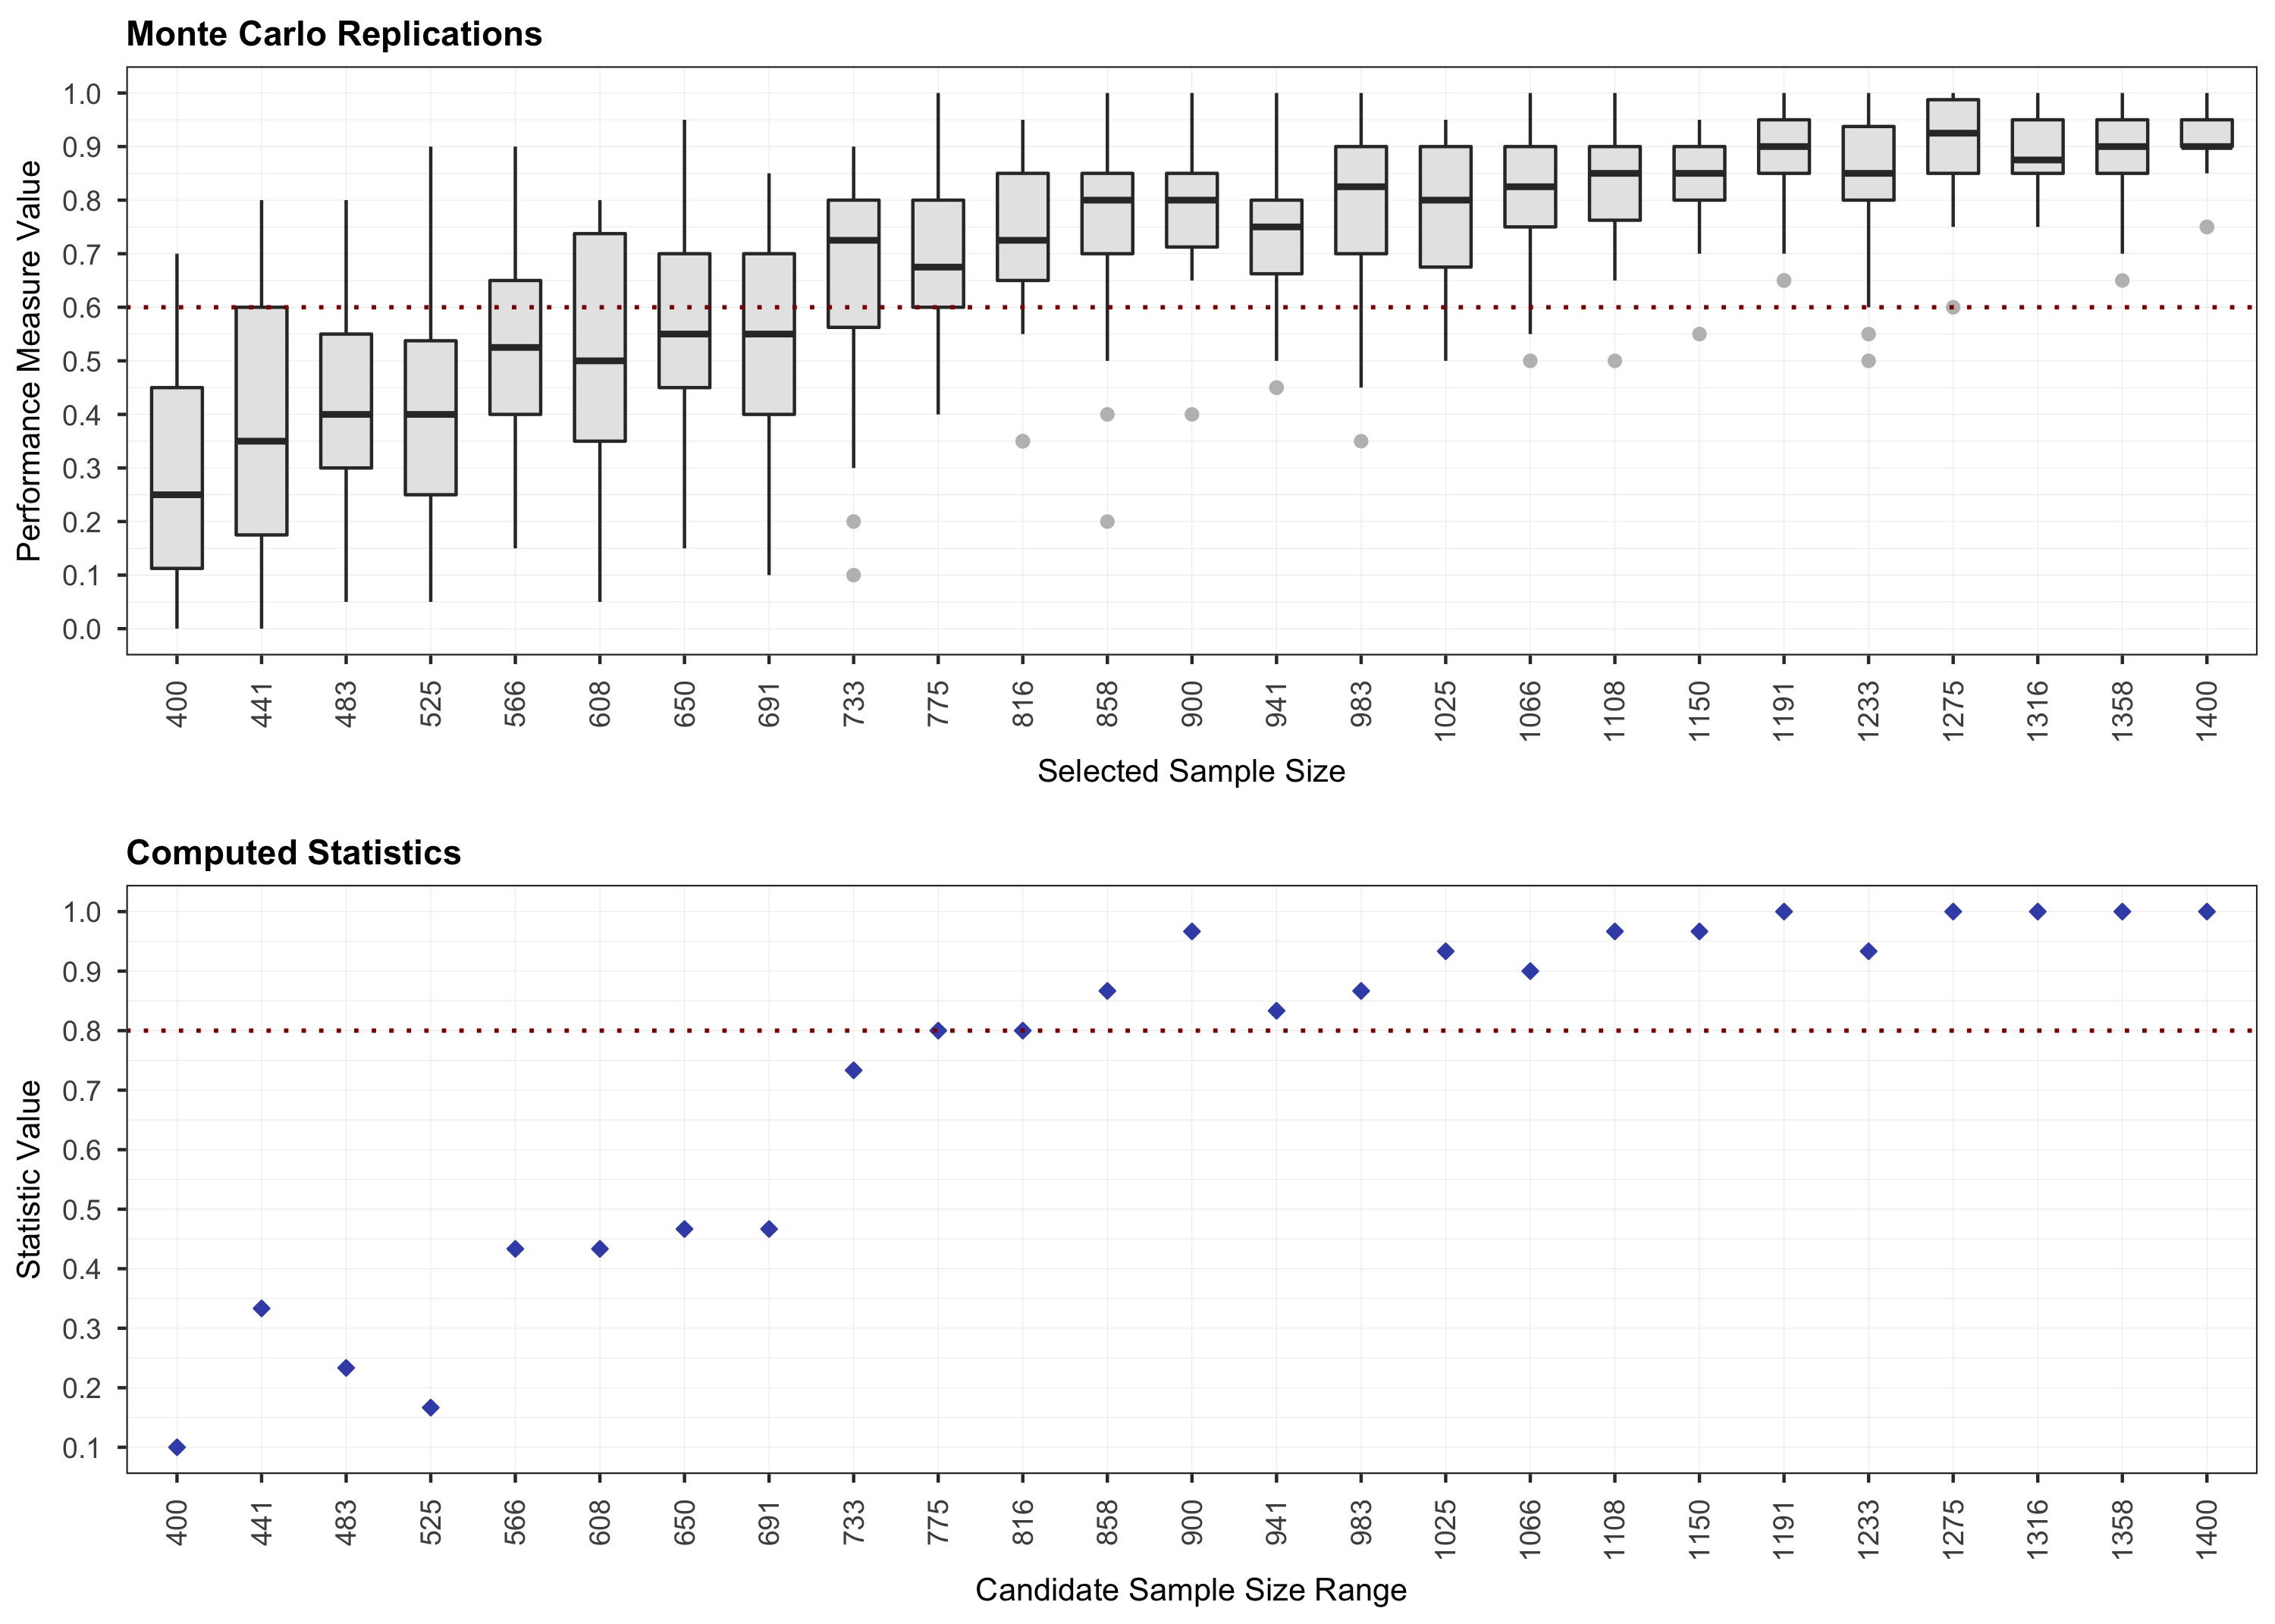
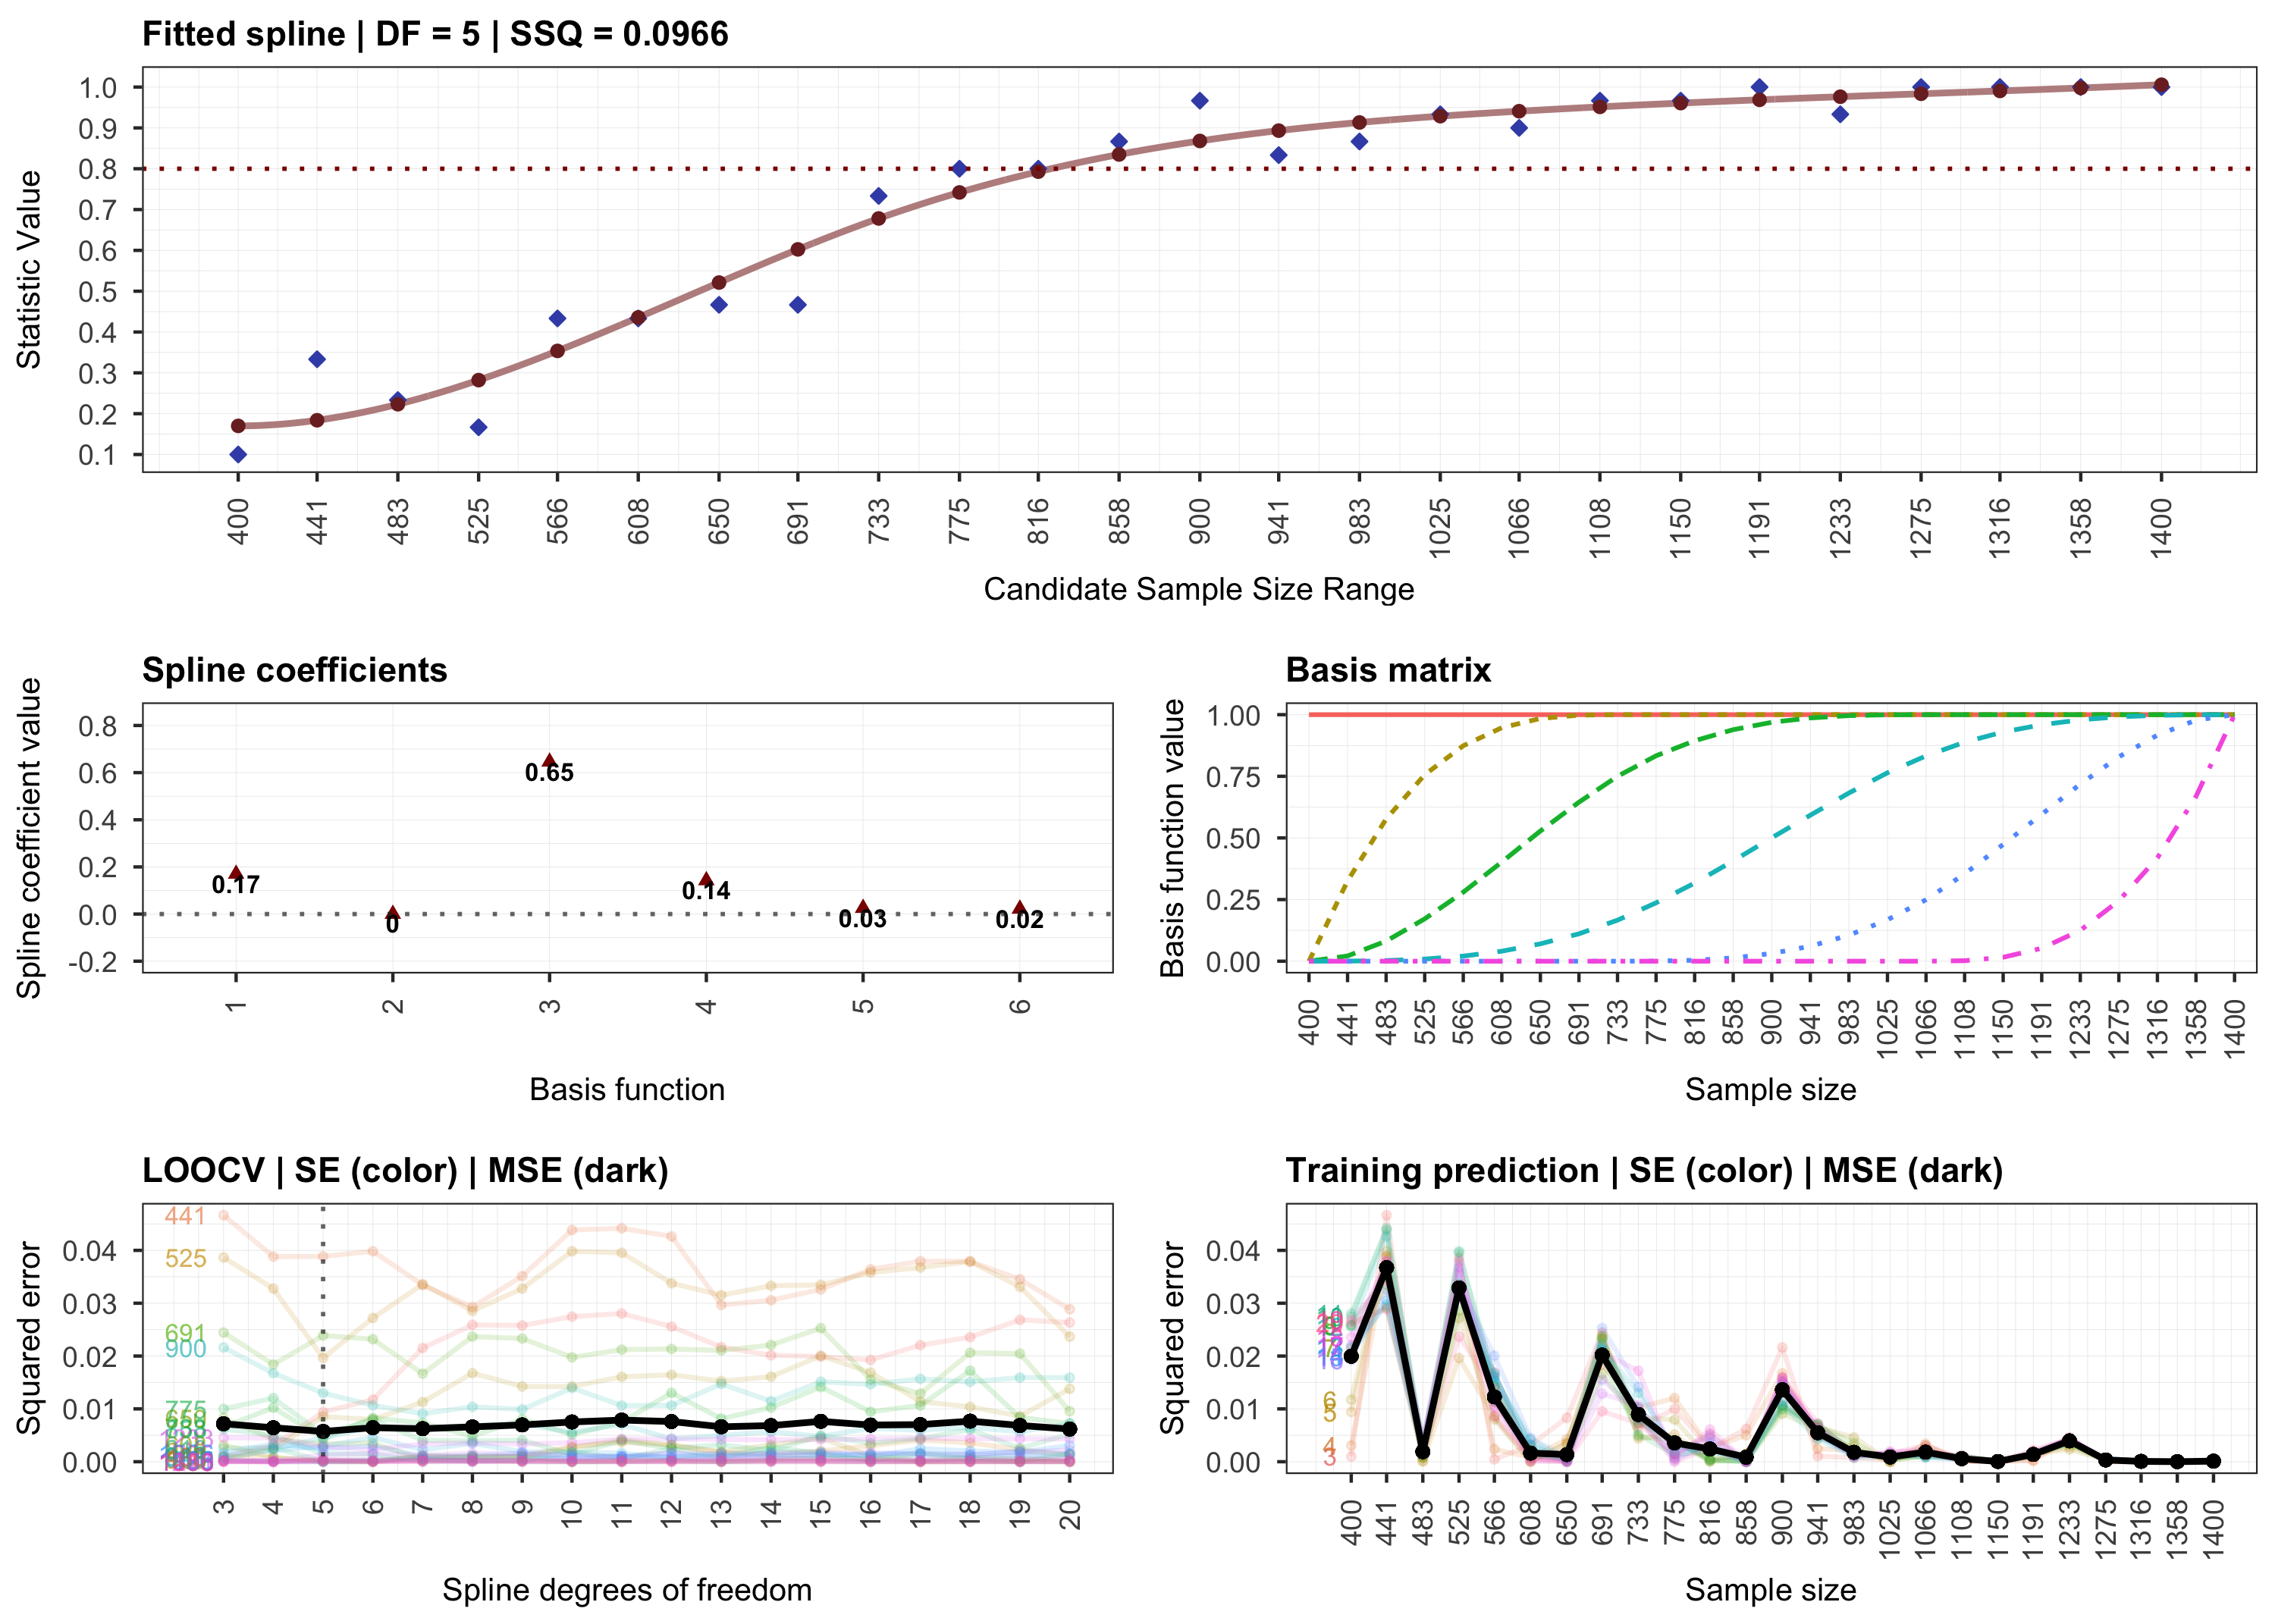
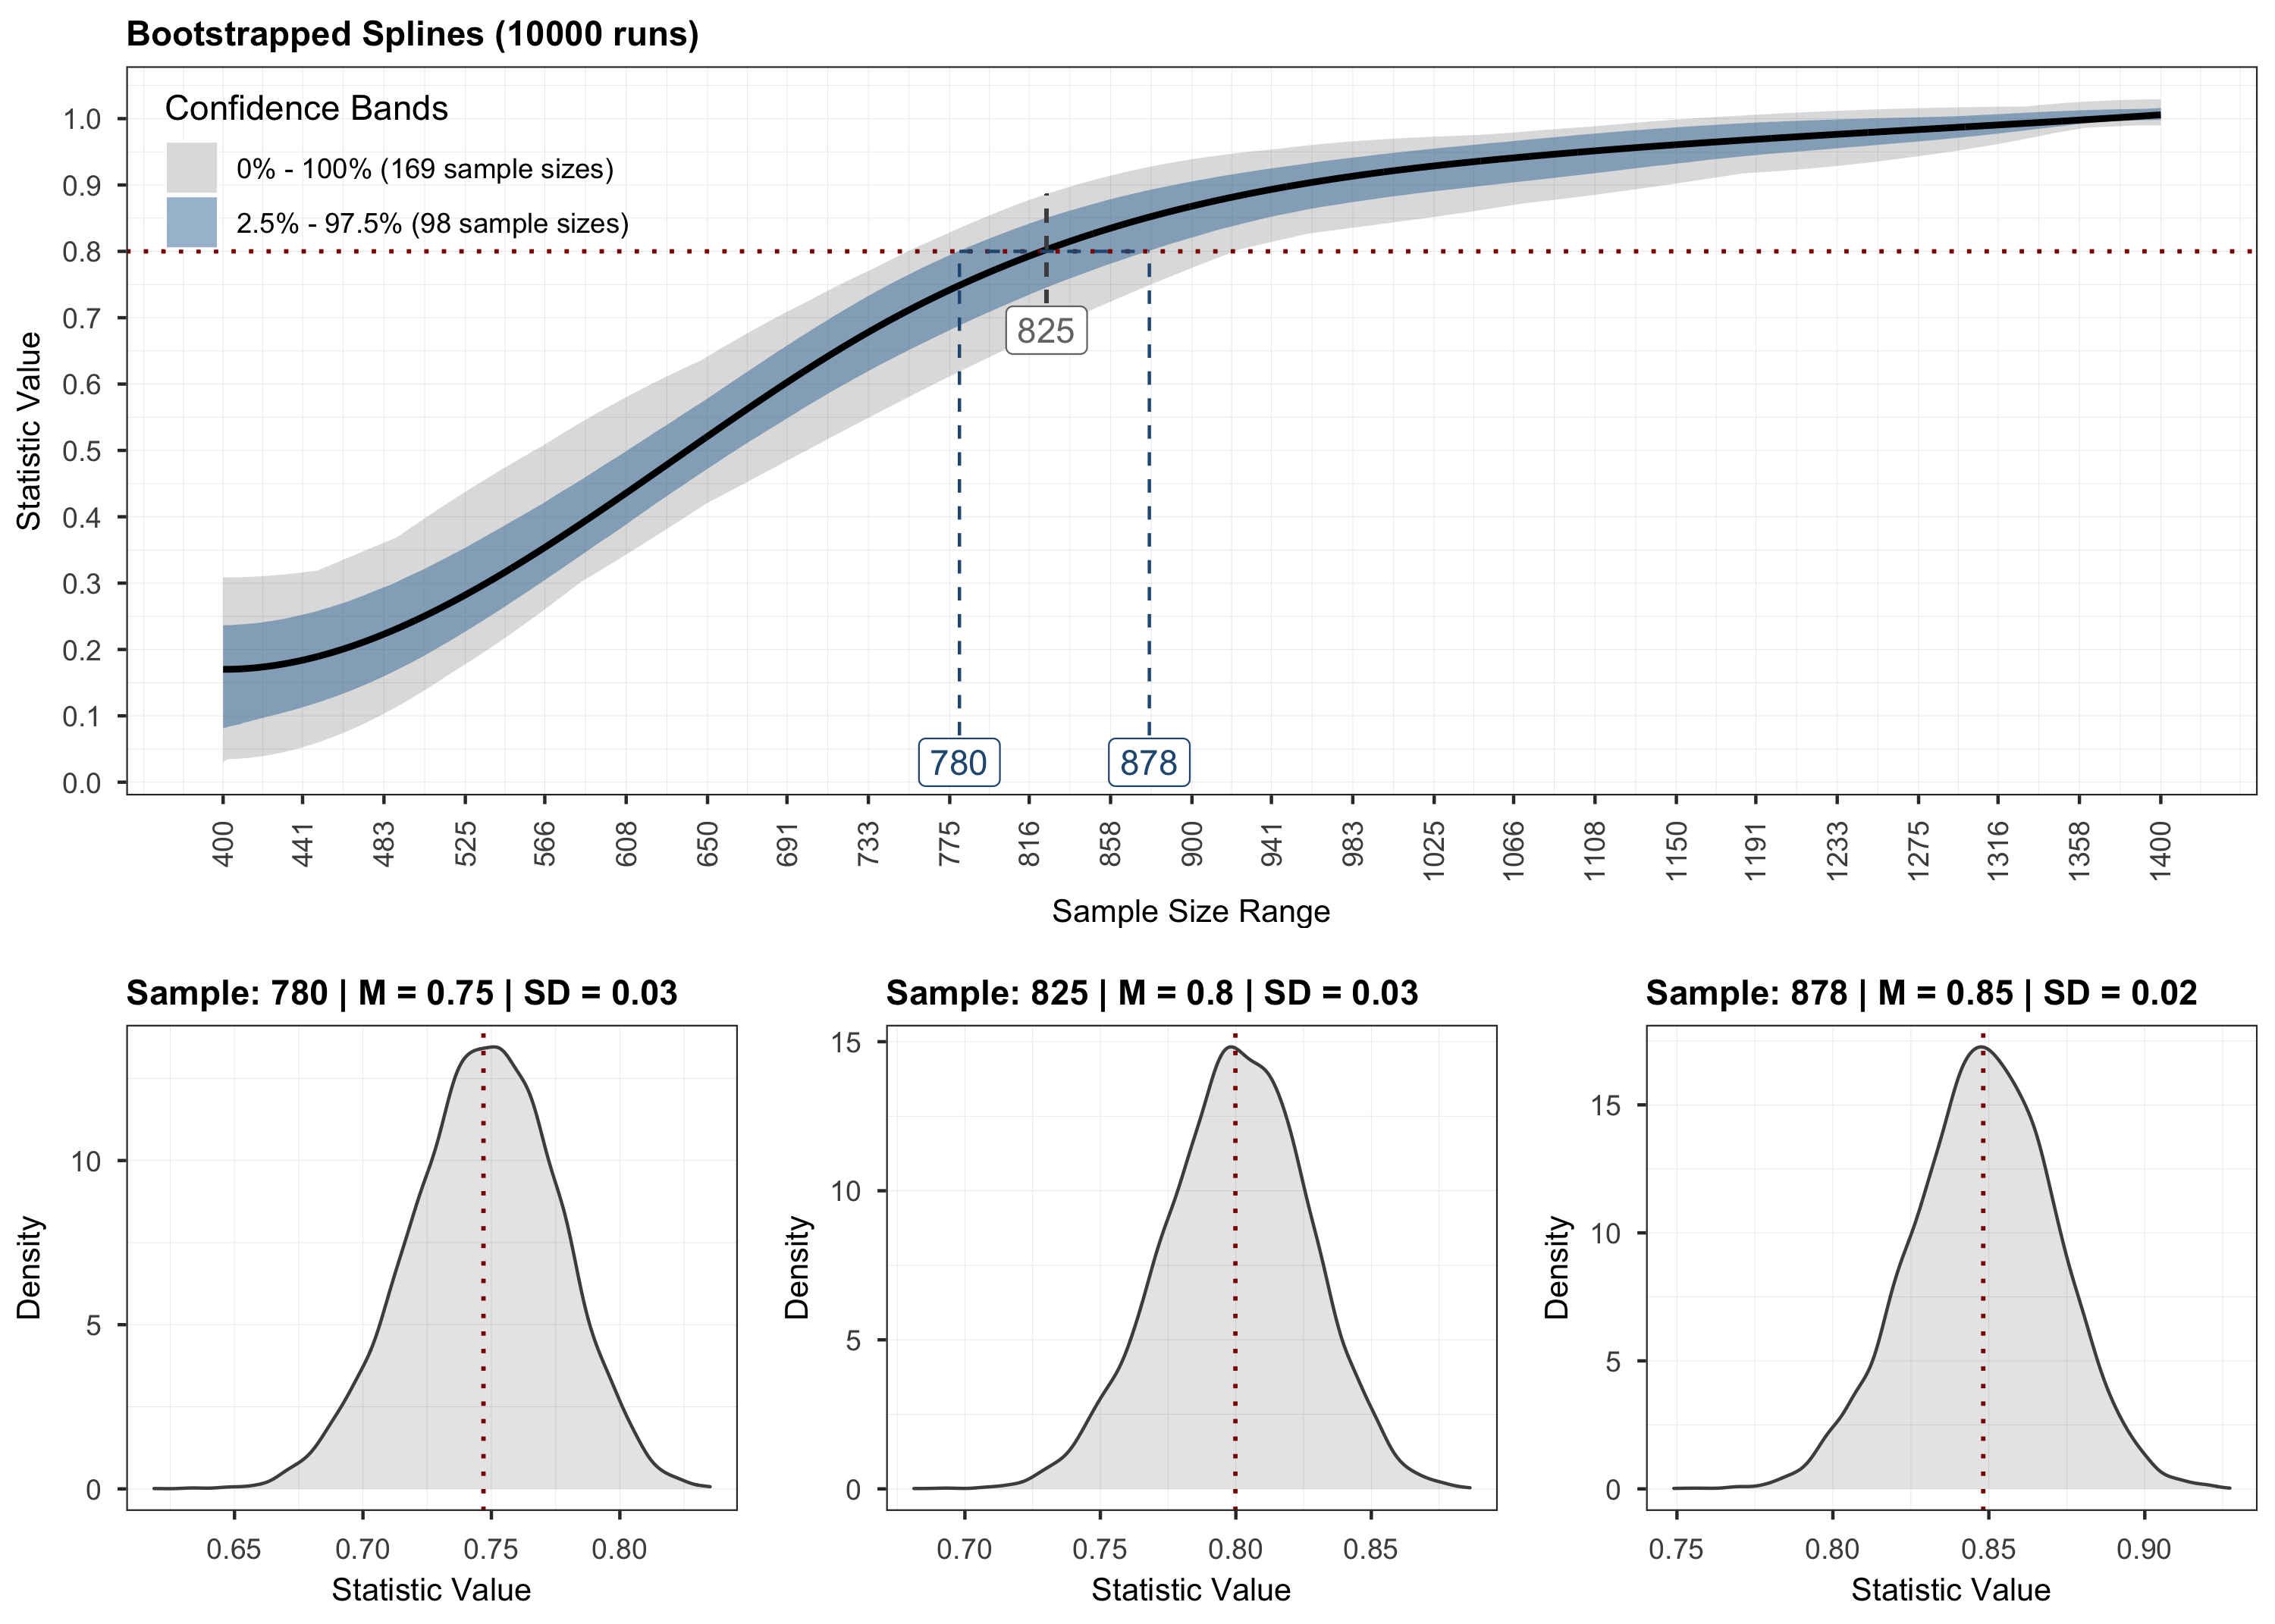
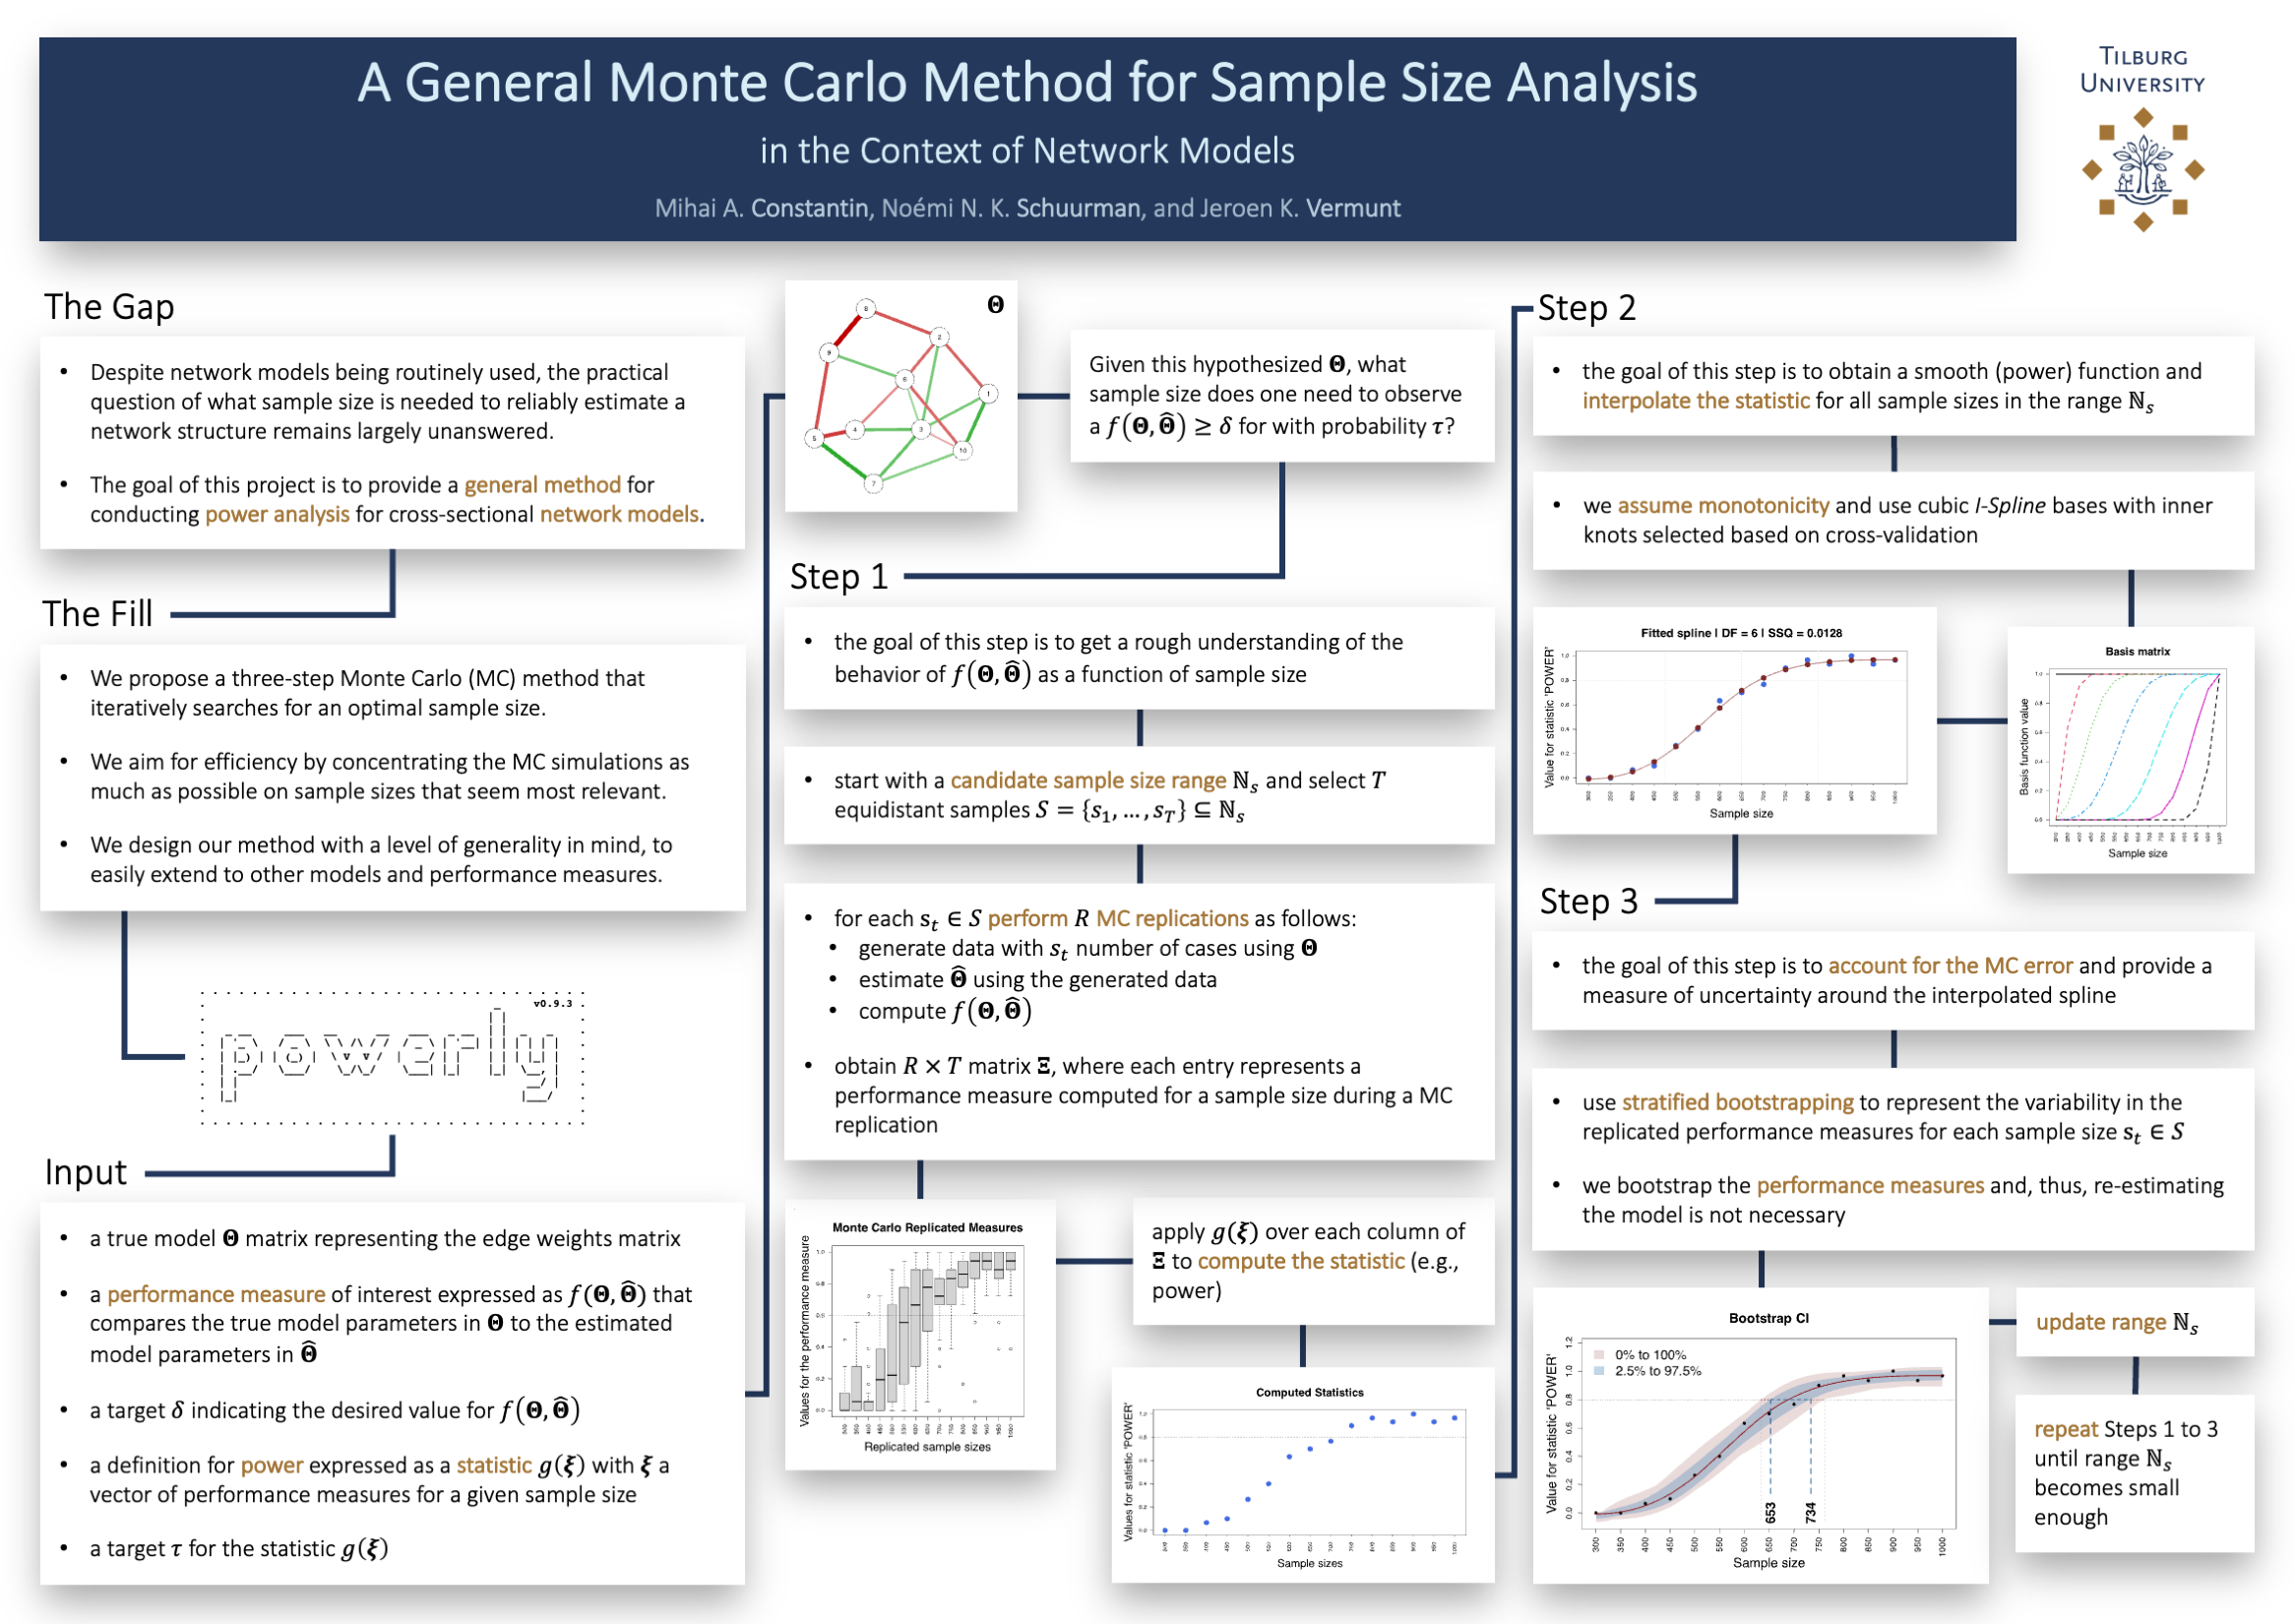
powerly is an R package that implements the method by Constantin et al. (2021) for conducting sample size analysis for cross-sectional network models. The method implemented is implemented in the main function powerly(). The implementation takes the form of a three-step recursive algorithm designed to find an optimal sample size value given a model specification and an outcome measure of interest. It starts with a Monte Carlo simulation step for computing the outcome at various sample sizes. It continues with a monotone curve-fitting step for interpolating the outcome. The final step employs stratified bootstrapping to quantify the uncertainty around the fitted curve. For more details on how the method works, check the manuscript linked above. Moreover, consult the method poster.
install.packages("powerly")remotes::install_github("mihaiconstantin/powerly")The code block below illustrates the main function in the package. For more information, see the documentation ?powerly.
# Suppose we want to find the sample size for observing a sensitivity of `0.6`
# with a probability of `0.8`, for a GGM true model consisting of `10` nodes
# with a density of `0.4`.

# We can run the method for an arbitrarily generated true model that matches
# those characteristics (i.e., number of nodes and density).
results <- powerly(
    range_lower = 300,
    range_upper = 1000,
    samples = 30,
    replications = 20,
    measure = "sen",
    statistic = "power",
    measure_value = .6,
    statistic_value = .8,
    model = "ggm",
    nodes = 10,
    density = .4,
    verbose = TRUE
)

# Or we omit the `nodes` and `density` arguments and specify directly the edge
# weights matrix via the `model_matrix` argument.

# To get a matrix of edge weights we can use the `generate_model()` function.
true_model <- generate_model(type = "ggm", nodes = 10, density = .4)

# Then, supply the true model to the algorithm directly.
results <- powerly(
    range_lower = 300,
    range_upper = 1000,
    samples = 30,
    replications = 20,
    measure = "sen",
    statistic = "power",
    measure_value = .6,
    statistic_value = .8,
    model = "ggm",
    model_matrix = true_model,
    verbose = TRUE
)
To validate the results of the analysis, we can use the validate() method. For more information, see the documentation ?validate.
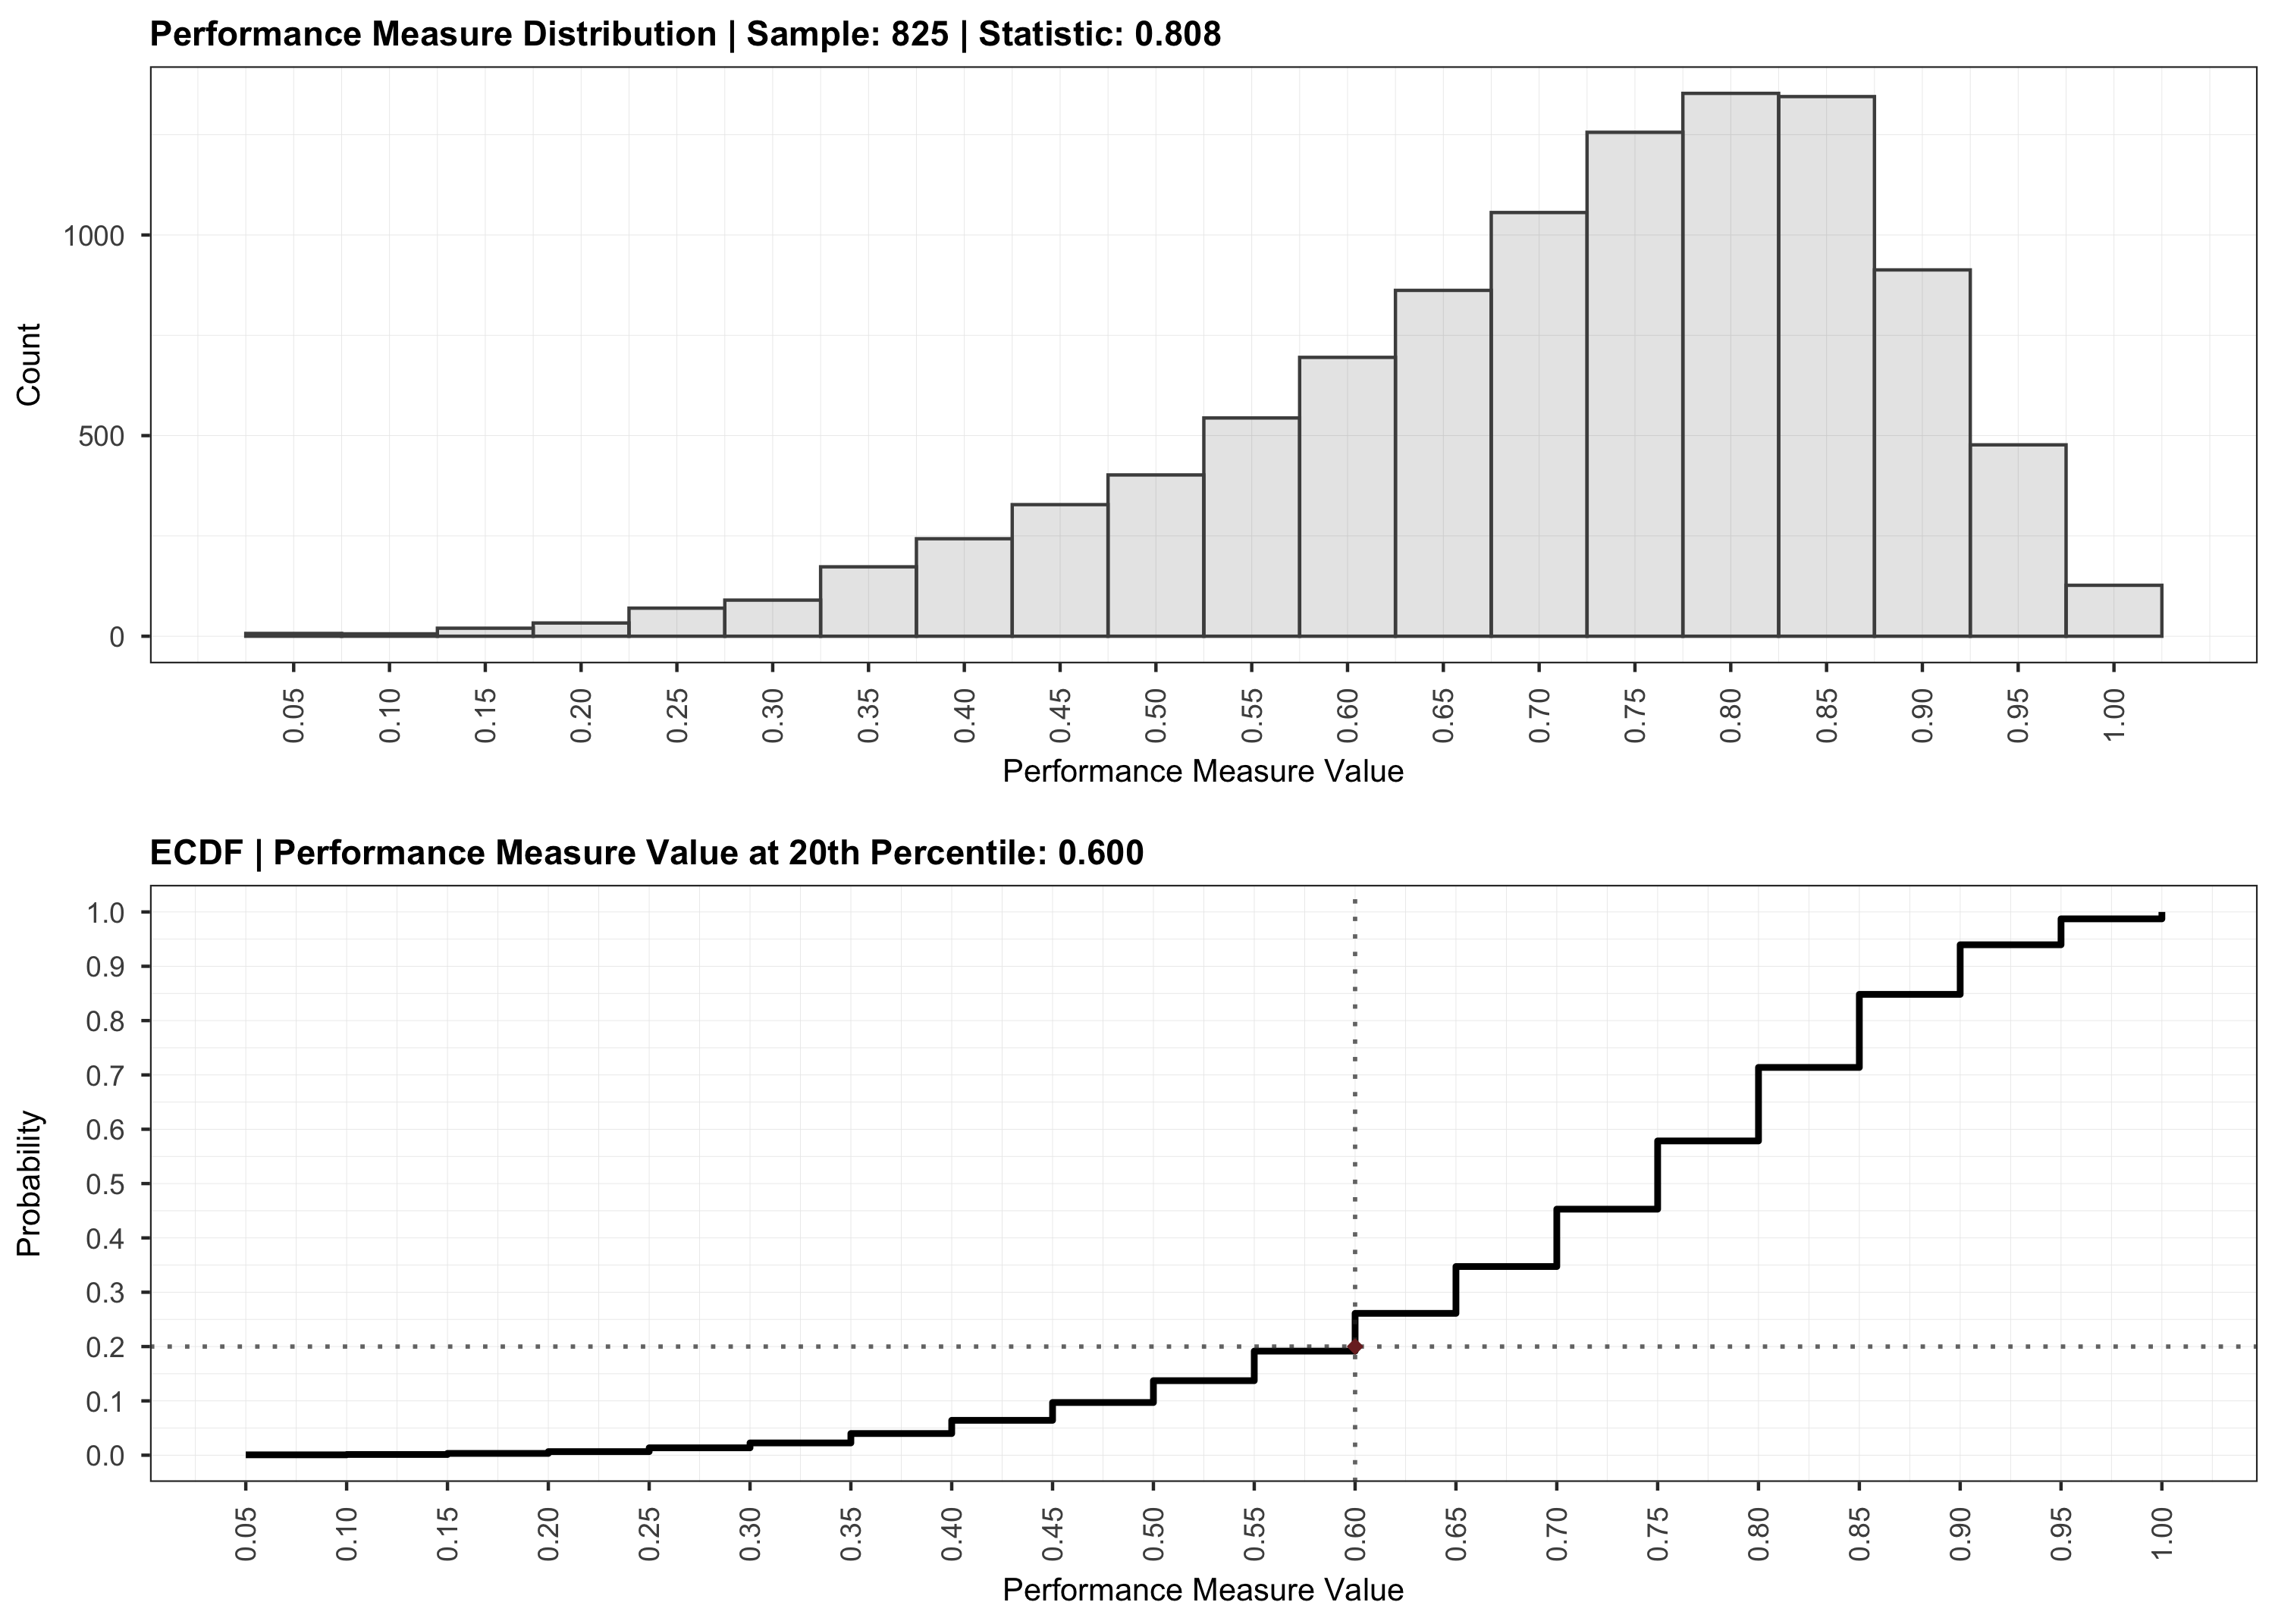
To visualize the results, we can use the plot function and indicating the step that should be plotted.
The code in this repository is licensed under the MIT license.
To use powerly please cite: - Constantin, M. A., Schuurman, N. K., & Vermunt, J. (2021). A General Monte Carlo Method for Sample Size Analysis in the Context of Network Models. PsyArXiv. https://doi.org/10.31234/osf.io/j5v7u