![]()

![]()
{readabs} helps you easily download, import, and tidy data from the Australian Bureau of Statistics within R. This saves you time manually downloading and tediously tidying data and allows you to spend more time on your analysis.
Install the latest CRAN version of {readabs} with:
You can install the development version of {readabs} from GitHub with:
# if you don't have devtools installed, first run:
# install.packages("devtools")
devtools::install_github("mattcowgill/readabs")The main function in {readabs} is read_abs(), which downloads, imports, and tidies time series data from the ABS website. Note that read_abs() only works with spreadsheets in the standard ABS time series format.
There are some other functions you may find useful.
read_abs_local() imports and tidies time series data from ABS spreadsheets stored on a local drive. Thanks to Hugh Parsonage for contributing to this functionality.separate_series() splits the series column of a tidied ABS time series spreadsheet into multiple columns, reducing the manual wrangling that’s needed to work with the data. Thanks to David Diviny for writing this function.download_abs_data_cube() downloads a data cube (ie. non-time series spreadsheet) from the ABS website. Thanks to David Diviny for writing this function.read_cpi() imports the Consumer Price Index numbers as a two-column tibble: date and cpi. This is useful for joining to other series to adjust data for changes in consumer prices.read_payrolls() downloads, imports, and tidies tables from the ABS Weekly Payroll Jobs dataset.read_awe() returns a long time series of Average Weekly Earnings data.To download all the time series data from an ABS catalogue number to your disk, and import the data to R as a single tidy data frame, use read_abs().
First we’ll load {readabs} and the {tidyverse}:
library(readabs)
#> Environment variable 'R_READABS_PATH' is unset. Downloaded files will be saved in a temporary directory.
#> You can set 'R_READABS_PATH' at any time. To set it for the rest of this session, use
#>  Sys.setenv(R_READABS_PATH = <path>)
library(tidyverse)
#> ── Attaching packages ─────────────────────────────────────── tidyverse 1.3.1 ──
#> ✓ ggplot2 3.3.5     ✓ purrr   0.3.4
#> ✓ tibble  3.1.5     ✓ dplyr   1.0.7
#> ✓ tidyr   1.1.4     ✓ stringr 1.4.0
#> ✓ readr   2.0.2     ✓ forcats 0.5.1
#> ── Conflicts ────────────────────────────────────────── tidyverse_conflicts() ──
#> x dplyr::filter() masks stats::filter()
#> x dplyr::lag()    masks stats::lag()
library(readxl)
Now we’ll create one data frame that contains all the time series data from the Wage Price Index, catalogue number 6345.0:
all_wpi <- read_abs("6345.0")
#> Finding URLs for tables corresponding to ABS catalogue 6345.0
#> Attempting to download files from catalogue 6345.0, Wage Price Index, Australia
#> Downloading https://www.abs.gov.au/statistics/economy/price-indexes-and-inflation/wage-price-index-australia/latest-release/634501.xls
#> Downloading https://www.abs.gov.au/statistics/economy/price-indexes-and-inflation/wage-price-index-australia/latest-release/634502a.xls
#> Downloading https://www.abs.gov.au/statistics/economy/price-indexes-and-inflation/wage-price-index-australia/latest-release/634502b.xls
#> Downloading https://www.abs.gov.au/statistics/economy/price-indexes-and-inflation/wage-price-index-australia/latest-release/634503a.xls
#> Downloading https://www.abs.gov.au/statistics/economy/price-indexes-and-inflation/wage-price-index-australia/latest-release/634503b.xls
#> Downloading https://www.abs.gov.au/statistics/economy/price-indexes-and-inflation/wage-price-index-australia/latest-release/634504a.xls
#> Downloading https://www.abs.gov.au/statistics/economy/price-indexes-and-inflation/wage-price-index-australia/latest-release/634504b.xls
#> Downloading https://www.abs.gov.au/statistics/economy/price-indexes-and-inflation/wage-price-index-australia/latest-release/634505a.xls
#> Downloading https://www.abs.gov.au/statistics/economy/price-indexes-and-inflation/wage-price-index-australia/latest-release/634505b.xls
#> Downloading https://www.abs.gov.au/statistics/economy/price-indexes-and-inflation/wage-price-index-australia/latest-release/634507a.xls
#> Downloading https://www.abs.gov.au/statistics/economy/price-indexes-and-inflation/wage-price-index-australia/latest-release/634507b.xls
#> Downloading https://www.abs.gov.au/statistics/economy/price-indexes-and-inflation/wage-price-index-australia/latest-release/634508a.xls
#> Downloading https://www.abs.gov.au/statistics/economy/price-indexes-and-inflation/wage-price-index-australia/latest-release/634508b.xls
#> Downloading https://www.abs.gov.au/statistics/economy/price-indexes-and-inflation/wage-price-index-australia/latest-release/634509a.xls
#> Downloading https://www.abs.gov.au/statistics/economy/price-indexes-and-inflation/wage-price-index-australia/latest-release/634509b.xls
#> Downloading https://www.abs.gov.au/statistics/economy/price-indexes-and-inflation/wage-price-index-australia/latest-release/63450table2ato9a.xls
#> Downloading https://www.abs.gov.au/statistics/economy/price-indexes-and-inflation/wage-price-index-australia/latest-release/63450table2bto9b.xls
#> Extracting data from downloaded spreadsheets
#> Tidying data from imported ABS spreadsheets
This is what it looks like:
str(all_wpi)
#> tibble [61,392 × 12] (S3: tbl_df/tbl/data.frame)
#>  $ table_no        : chr [1:61392] "634501" "634501" "634501" "634501" ...
#>  $ sheet_no        : chr [1:61392] "Data1" "Data1" "Data1" "Data1" ...
#>  $ table_title     : chr [1:61392] "Table 1. Total Hourly Rates of Pay Excluding Bonuses: Sector, Original, Seasonally Adjusted and Trend" "Table 1. Total Hourly Rates of Pay Excluding Bonuses: Sector, Original, Seasonally Adjusted and Trend" "Table 1. Total Hourly Rates of Pay Excluding Bonuses: Sector, Original, Seasonally Adjusted and Trend" "Table 1. Total Hourly Rates of Pay Excluding Bonuses: Sector, Original, Seasonally Adjusted and Trend" ...
#>  $ date            : Date[1:61392], format: "1997-09-01" "1997-09-01" ...
#>  $ series          : chr [1:61392] "Quarterly Index ;  Total hourly rates of pay excluding bonuses ;  Australia ;  Private ;  All industries ;" "Quarterly Index ;  Total hourly rates of pay excluding bonuses ;  Australia ;  Public ;  All industries ;" "Quarterly Index ;  Total hourly rates of pay excluding bonuses ;  Australia ;  Private and Public ;  All industries ;" "Quarterly Index ;  Total hourly rates of pay excluding bonuses ;  Australia ;  Private ;  All industries ;" ...
#>  $ value           : num [1:61392] 67.4 64.7 66.7 67.3 64.8 66.6 67.3 64.8 66.7 NA ...
#>  $ series_type     : chr [1:61392] "Original" "Original" "Original" "Seasonally Adjusted" ...
#>  $ data_type       : chr [1:61392] "INDEX" "INDEX" "INDEX" "INDEX" ...
#>  $ collection_month: chr [1:61392] "3" "3" "3" "3" ...
#>  $ frequency       : chr [1:61392] "Quarter" "Quarter" "Quarter" "Quarter" ...
#>  $ series_id       : chr [1:61392] "A2603039T" "A2603989W" "A2603609J" "A2713846W" ...
#>  $ unit            : chr [1:61392] "Index Numbers" "Index Numbers" "Index Numbers" "Index Numbers" ...
It only takes you a few lines of code to make a graph from your data:
all_wpi %>%
  filter(series == "Percentage Change From Corresponding Quarter of Previous Year ;  Australia ;  Total hourly rates of pay excluding bonuses ;  Private and Public ;  All industries ;",
         !is.na(value)) %>%
  ggplot(aes(x = date, y = value, col = series_type)) +
  geom_line() +
  theme_minimal() +
  labs(y = "Annual wage growth (per cent)")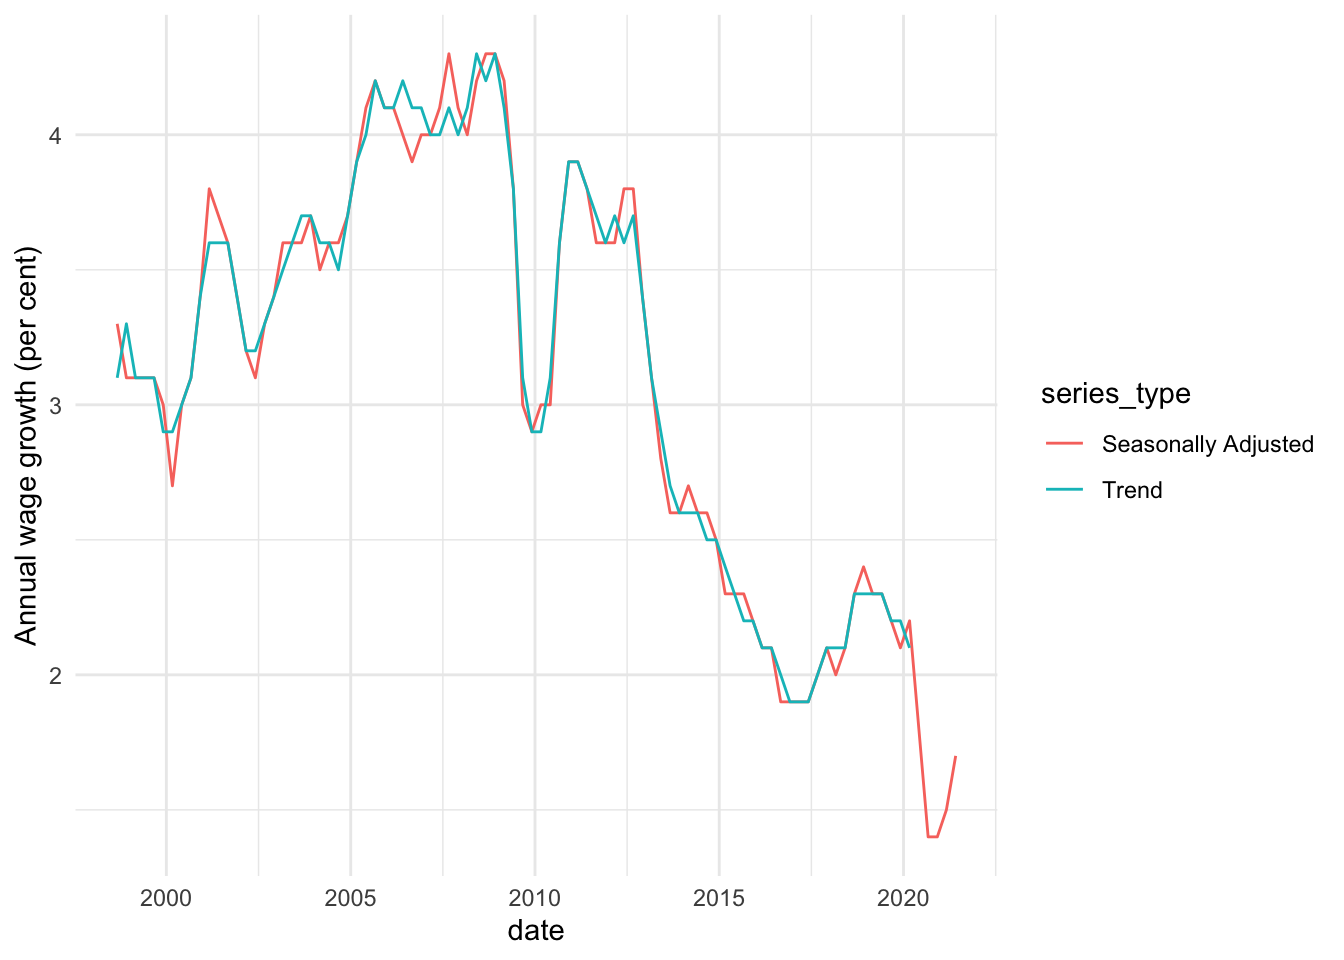
In the example above we downloaded all the time series from a catalogue number. This will often be overkill. If you know the data you need is in a particular table, you can just get that table like this:
wpi_t1 <- read_abs("6345.0", tables = 1)
#> Warning in read_abs("6345.0", tables = 1): `tables` was providedyet `check_local
#> = TRUE` and fst files are available so `tables` will be ignored.
If you want multiple tables, but not the whole catalogue, that’s easy too:
wpi_t1_t5 <- read_abs("6345.0", tables = c("1", "5a"))
#> Warning in read_abs("6345.0", tables = c("1", "5a")): `tables` was providedyet
#> `check_local = TRUE` and fst files are available so `tables` will be ignored.
In most cases, the series column will contain multiple components, separated by ‘;’. The separate_series() function can help wrangling this column.
For more examples, please see the vignette on working with time series data (run browseVignettes("readabs")).
The ABS (generally) releases time series data in a standard format, which allows read_abs() to download, import and tidy it (see above). But not all ABS data is time series data - the ABS also releases data as ‘data cubes’. These are all formatted in their own, unique way.
Unfortunately, because data cubes are all formatted in their own way, there is no one function that can import tidy data cubes for you in the same way that read_abs() works with all time series. But {readabs} still has functions that can help.
The download_abs_data_cube() function can download an ABS data cube for you. It works with any data cube on the ABS website.
For example, let’s say you wanted to download table 4 from Weekly Payroll Jobs and Wages in Australia. This code would do the trick:
payrolls_t4_path <- download_abs_data_cube("weekly-payroll-jobs-and-wages-australia", "004")
#> File downloaded in /var/folders/_4/ngvkm2811nbd8b_v66wytw1r0000gn/T//Rtmp3viWaA/6160055001_DO004.xlsx

payrolls_t4_path
#> [1] "/var/folders/_4/ngvkm2811nbd8b_v66wytw1r0000gn/T//Rtmp3viWaA/6160055001_DO004.xlsx"
The download_abs_data_cube() function downloads the file and returns the full file path to the saved file. You can then pipe that in to another function:
payrolls_t4_path %>%
  read_excel(sheet = "Payroll jobs index",
                     skip = 5)
#> # A tibble: 4,322 × 93
#>    `State or Territ… `Industry divisi… Sex   `Age group` `43834` `43841` `43848`
#>    <chr>             <chr>             <chr> <chr>       <chr>   <chr>   <chr>
#>  1 0. Australia      0. All industries 0. P… 0. All ages 92.86   95.3    96.84
#>  2 0. Australia      0. All industries 0. P… 1. 15-19    91.01   94.01   96.65
#>  3 0. Australia      0. All industries 0. P… 2. 20-29    92.03   95.02   97.16
#>  4 0. Australia      0. All industries 0. P… 3. 30-39    93.55   95.86   97.2
#>  5 0. Australia      0. All industries 0. P… 4. 40-49    93.55   95.66   96.87
#>  6 0. Australia      0. All industries 0. P… 5. 50-59    93.61   95.83   97.09
#>  7 0. Australia      0. All industries 0. P… 6. 60-69    91.62   93.78   94.97
#>  8 0. Australia      0. All industries 0. P… 7. 70 and … 87.11   89.39   90.65
#>  9 0. Australia      0. All industries 1. M… 0. All ages 92.62   95.7    97.5
#> 10 0. Australia      0. All industries 1. M… 1. 15-19    89.54   93.5    96.52
#> # … with 4,312 more rows, and 86 more variables: 43855 <chr>, 43862 <chr>,
#> #   43869 <chr>, 43876 <chr>, 43883 <chr>, 43890 <chr>, 43897 <chr>,
#> #   43904 <chr>, 43911 <chr>, 43918 <chr>, 43925 <chr>, 43932 <chr>,
#> #   43939 <chr>, 43946 <chr>, 43953 <chr>, 43960 <chr>, 43967 <chr>,
#> #   43974 <chr>, 43981 <chr>, 43988 <chr>, 43995 <chr>, 44002 <chr>,
#> #   44009 <chr>, 44016 <chr>, 44023 <chr>, 44030 <chr>, 44037 <chr>,
#> # 44044 <chr>, 44051 <chr>, 44058 <chr>, 44065 <chr>, 44072 <chr>, …As it happens, if you want the ABS Weekly Payrolls data, you don’t need to use download_abs_data_cube() directly. Instead, there is a convenience function available that downloads, imports, and tidies the data for you:
read_payrolls()
#> File downloaded in /var/folders/_4/ngvkm2811nbd8b_v66wytw1r0000gn/T//Rtmp3viWaA/6160055001_DO004.xlsx
#> # A tibble: 76,718 × 7
#>    state     industry       sex     age      date       value series
#>    <chr>     <chr>          <chr>   <chr>    <date>     <dbl> <chr>
#>  1 Australia All industries Persons All ages 2020-01-04  92.9 jobs
#>  2 Australia All industries Persons All ages 2020-01-11  95.3 jobs
#>  3 Australia All industries Persons All ages 2020-01-18  96.8 jobs
#>  4 Australia All industries Persons All ages 2020-01-25  97.7 jobs
#>  5 Australia All industries Persons All ages 2020-02-01  98.2 jobs
#>  6 Australia All industries Persons All ages 2020-02-08  98.7 jobs
#>  7 Australia All industries Persons All ages 2020-02-15  99.2 jobs
#>  8 Australia All industries Persons All ages 2020-02-22  99.4 jobs
#>  9 Australia All industries Persons All ages 2020-02-29  99.3 jobs
#> 10 Australia All industries Persons All ages 2020-03-07  99.8 jobs
#> # … with 76,708 more rows
There is also a convenience function available for data cube GM1 from the monthly Labour Force data, which contains labour force gross flows:
read_lfs_grossflows()
#> File downloaded in /var/folders/_4/ngvkm2811nbd8b_v66wytw1r0000gn/T//Rtmp3viWaA/GM1.xlsx
#> # A tibble: 1,034,860 × 9
#>    date       sex   age    state lfs_current lfs_previous  persons unit  weights
#>    <date>     <chr> <chr>  <chr> <chr>       <chr>           <dbl> <chr> <chr>
#>  1 2001-10-01 Males 15-19… New … Employed f… Employed ful…  28.7   000s  curren…
#>  2 2001-10-01 Males 15-19… New … Employed f… Employed par…   3.02  000s  curren…
#>  3 2001-10-01 Males 15-19… New … Employed f… Unemployed      0.830 000s  curren…
#>  4 2001-10-01 Males 15-19… New … Employed f… Not in the l…   0.750 000s  curren…
#>  5 2001-10-01 Males 15-19… New … Employed f… Unmatched in…   2.74  000s  curren…
#>  6 2001-10-01 Males 15-19… New … Employed f… Incoming rot…   4.94  000s  curren…
#>  7 2001-10-01 Males 15-19… New … Employed p… Employed ful…   1.75  000s  curren…
#>  8 2001-10-01 Males 15-19… New … Employed p… Employed par…  42.1   000s  curren…
#>  9 2001-10-01 Males 15-19… New … Employed p… Unemployed      1.24  000s  curren…
#> 10 2001-10-01 Males 15-19… New … Employed p… Not in the l…   7.33  000s  curren…
#> # … with 1,034,850 more rowsGitHub issues containing error reports or feature requests are welcome. Please try to make a reprex (a minimal, reproducible example) if possible.
Alternatively you can email the package maintainer at mattcowgill at gmail dot com.
The {readabs} package is not associated with the Australian Bureau of Statistics. All data is provided subject to any restrictions and licensing arrangements noted on the ABS website.
![]()
We’re pleased to be included in a list of software that can be used to work with official statistics.