![]()
simulariatools is an open source collection of functions and tools useful to pre and post process data for air quality modelling and assessment. The package is developed and maintained by the people at Simularia and it is extensively used therein for daily jobs.
If you use this package in your work, please consider citing it. Refer to its Zenodo DOI to cite it.
Installation of simulariatools from GitHub can be easily done using the devtools package:
The same commands can also be used to upgrade the package.
Note: in order to use importADSOBIN() to import ADSO/BIN data files, a working installation of Python 3 is required. For more information about R and Python interoperability, please refer to reticulate documentation.
Firt, import air quality data from NetCDF or ADSO/BIN files with the appropriate convenience function:
library(simulariatools)
mydata <- importRaster(file = "./test/conc_avg.nc",
k = 1000,
destaggering = TRUE,
variable = "nox",
verbose = TRUE)
#> Loading required namespace: ncdf4
#>
#> Raster statistics -----------------------------------------------
#> X (min, max, dx) : 496000.000 519250.000 250.000
#> Y (min, max, dy) : 4943000.000 4955250.000 250.000
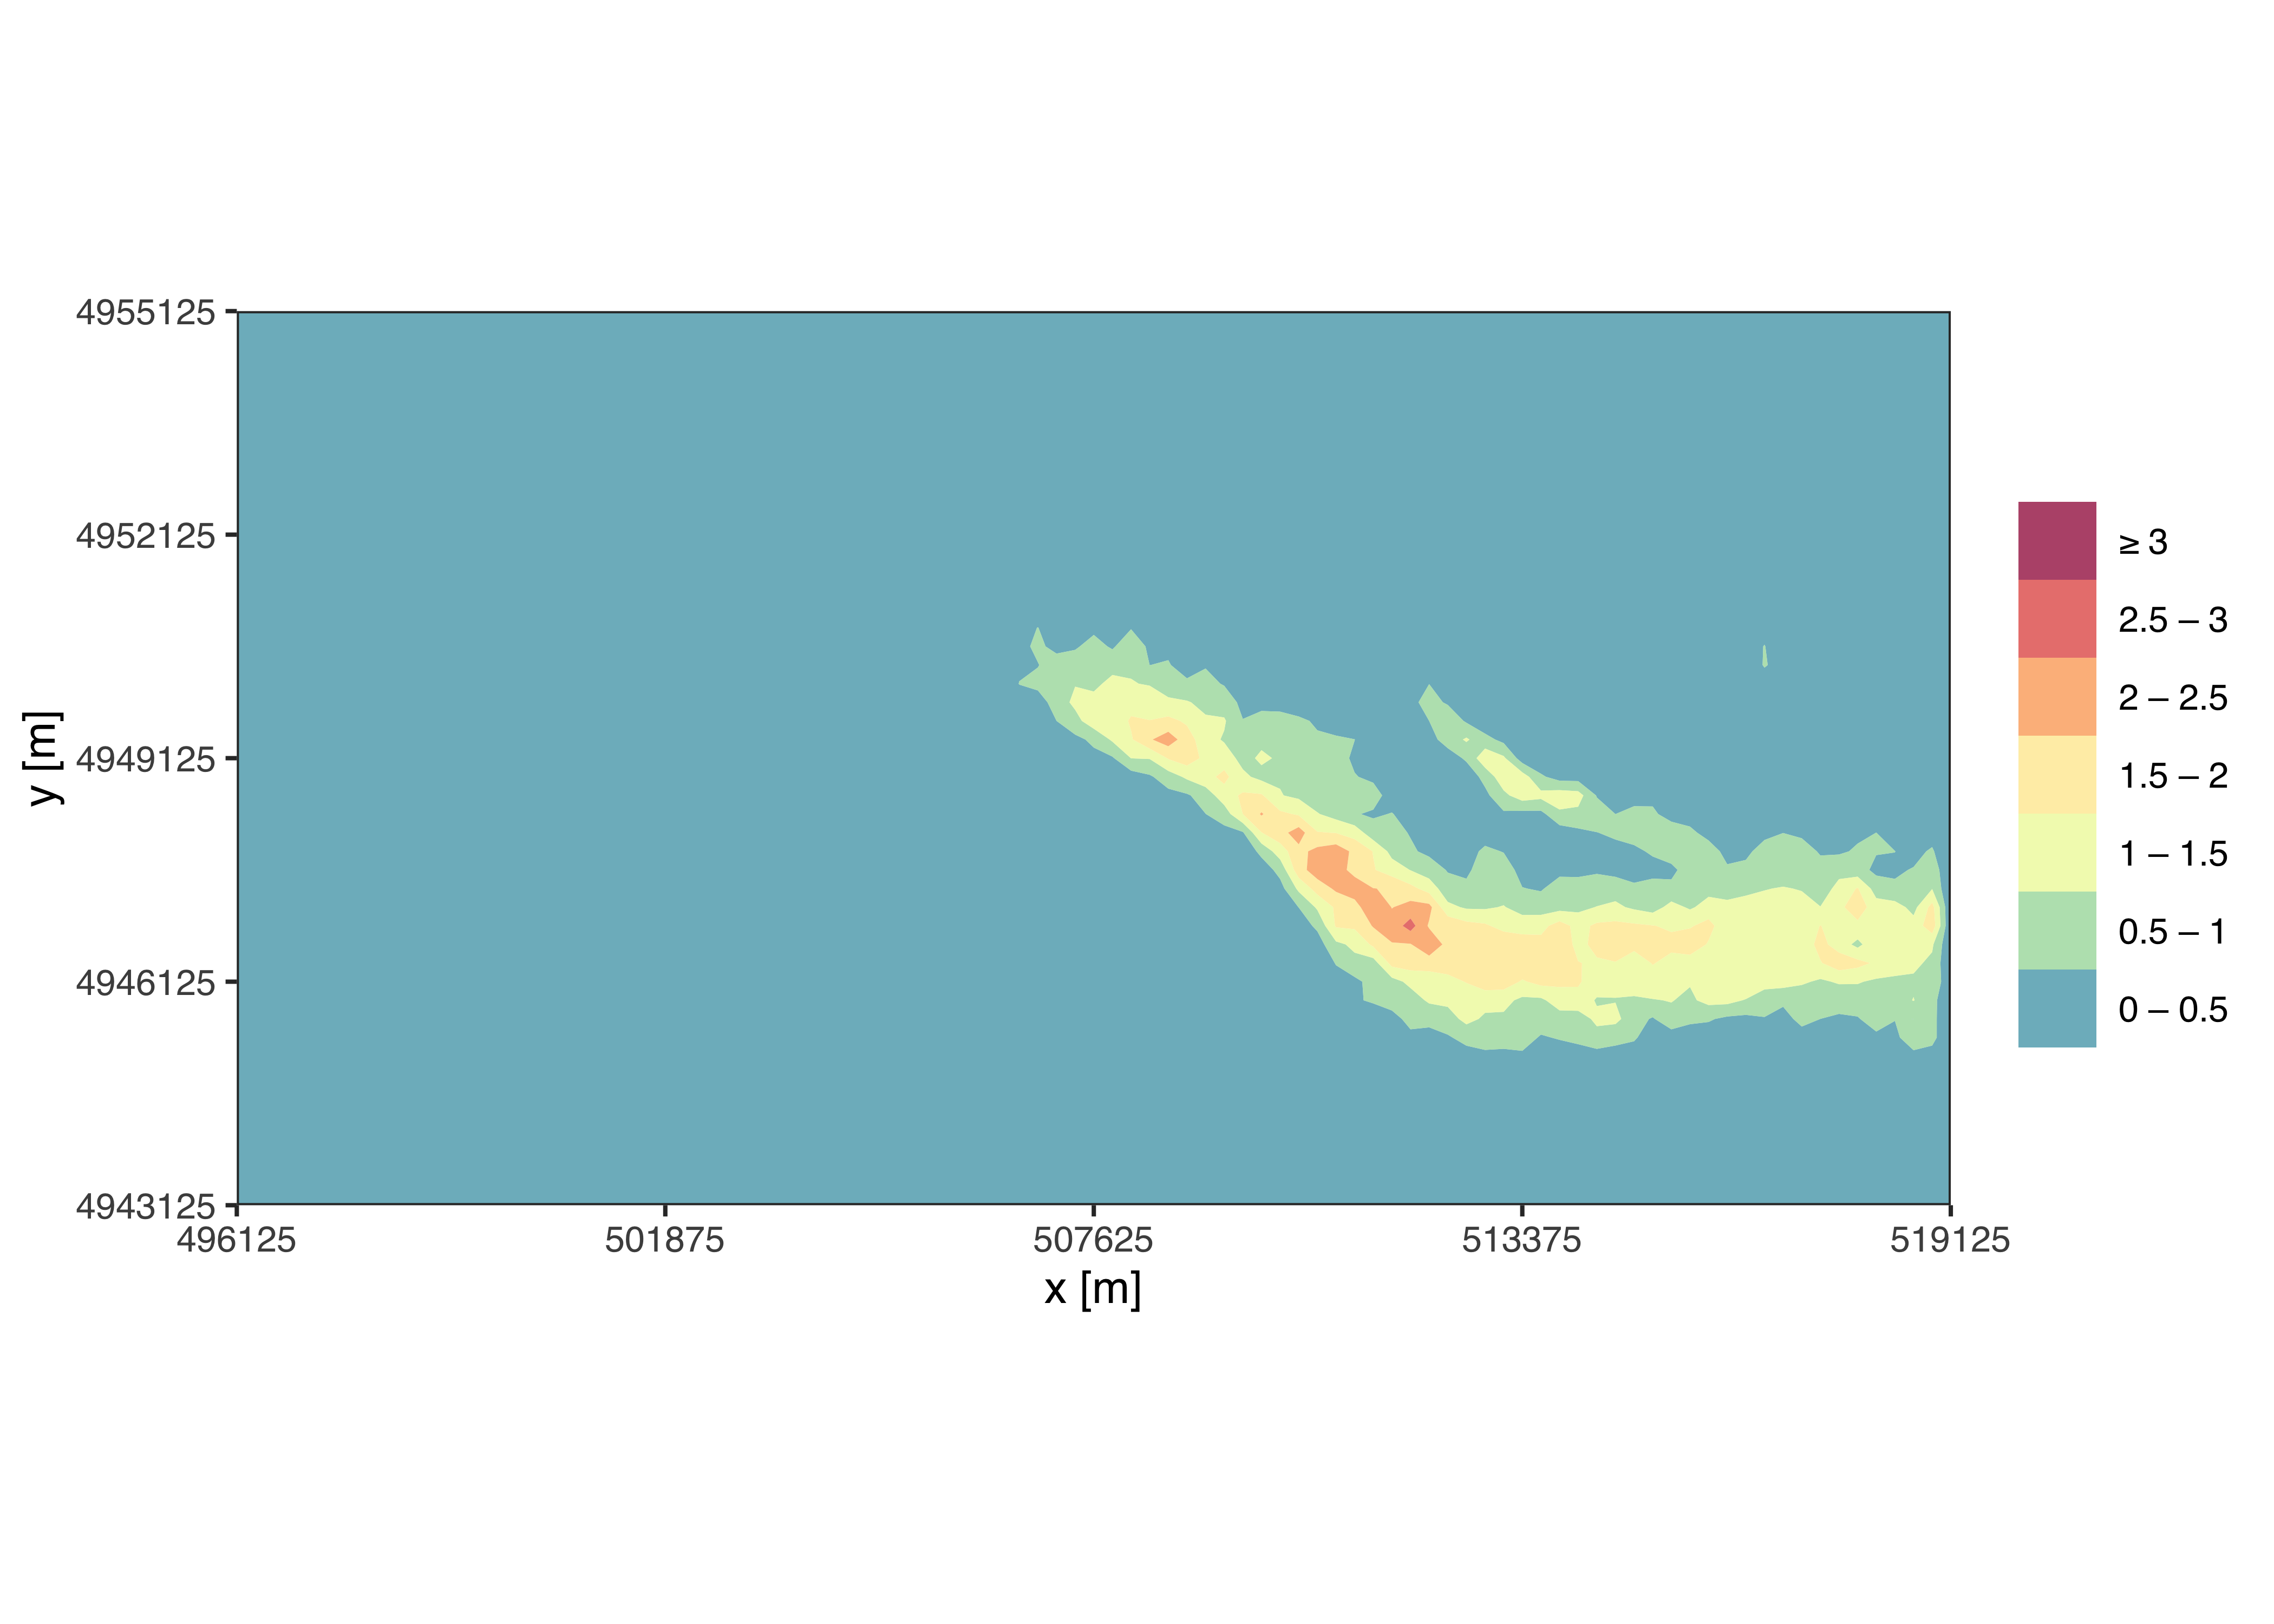
#> nox (min, max, mean): 0.00e+00 2.71e+00 1.52e-01
#> -----------------------------------------------------------------A quick contour plot with default configuration can be easily obtained by running contourPlot2() without any argument:
 The plot is customisable by using contourPlot2() arguments and by piping ggplot2 instructions:
library(ggplot2)
contourPlot2(mydata,
             domain = c(502000, 519000, 4943125, 4955125, 5, 5),
             levels = c(-Inf, 0.5, 1, 1.5, 2, Inf),
             legend = "NOx [ug/m3]") +
  labs(x = NULL, y = NULL) +
  theme_minimal()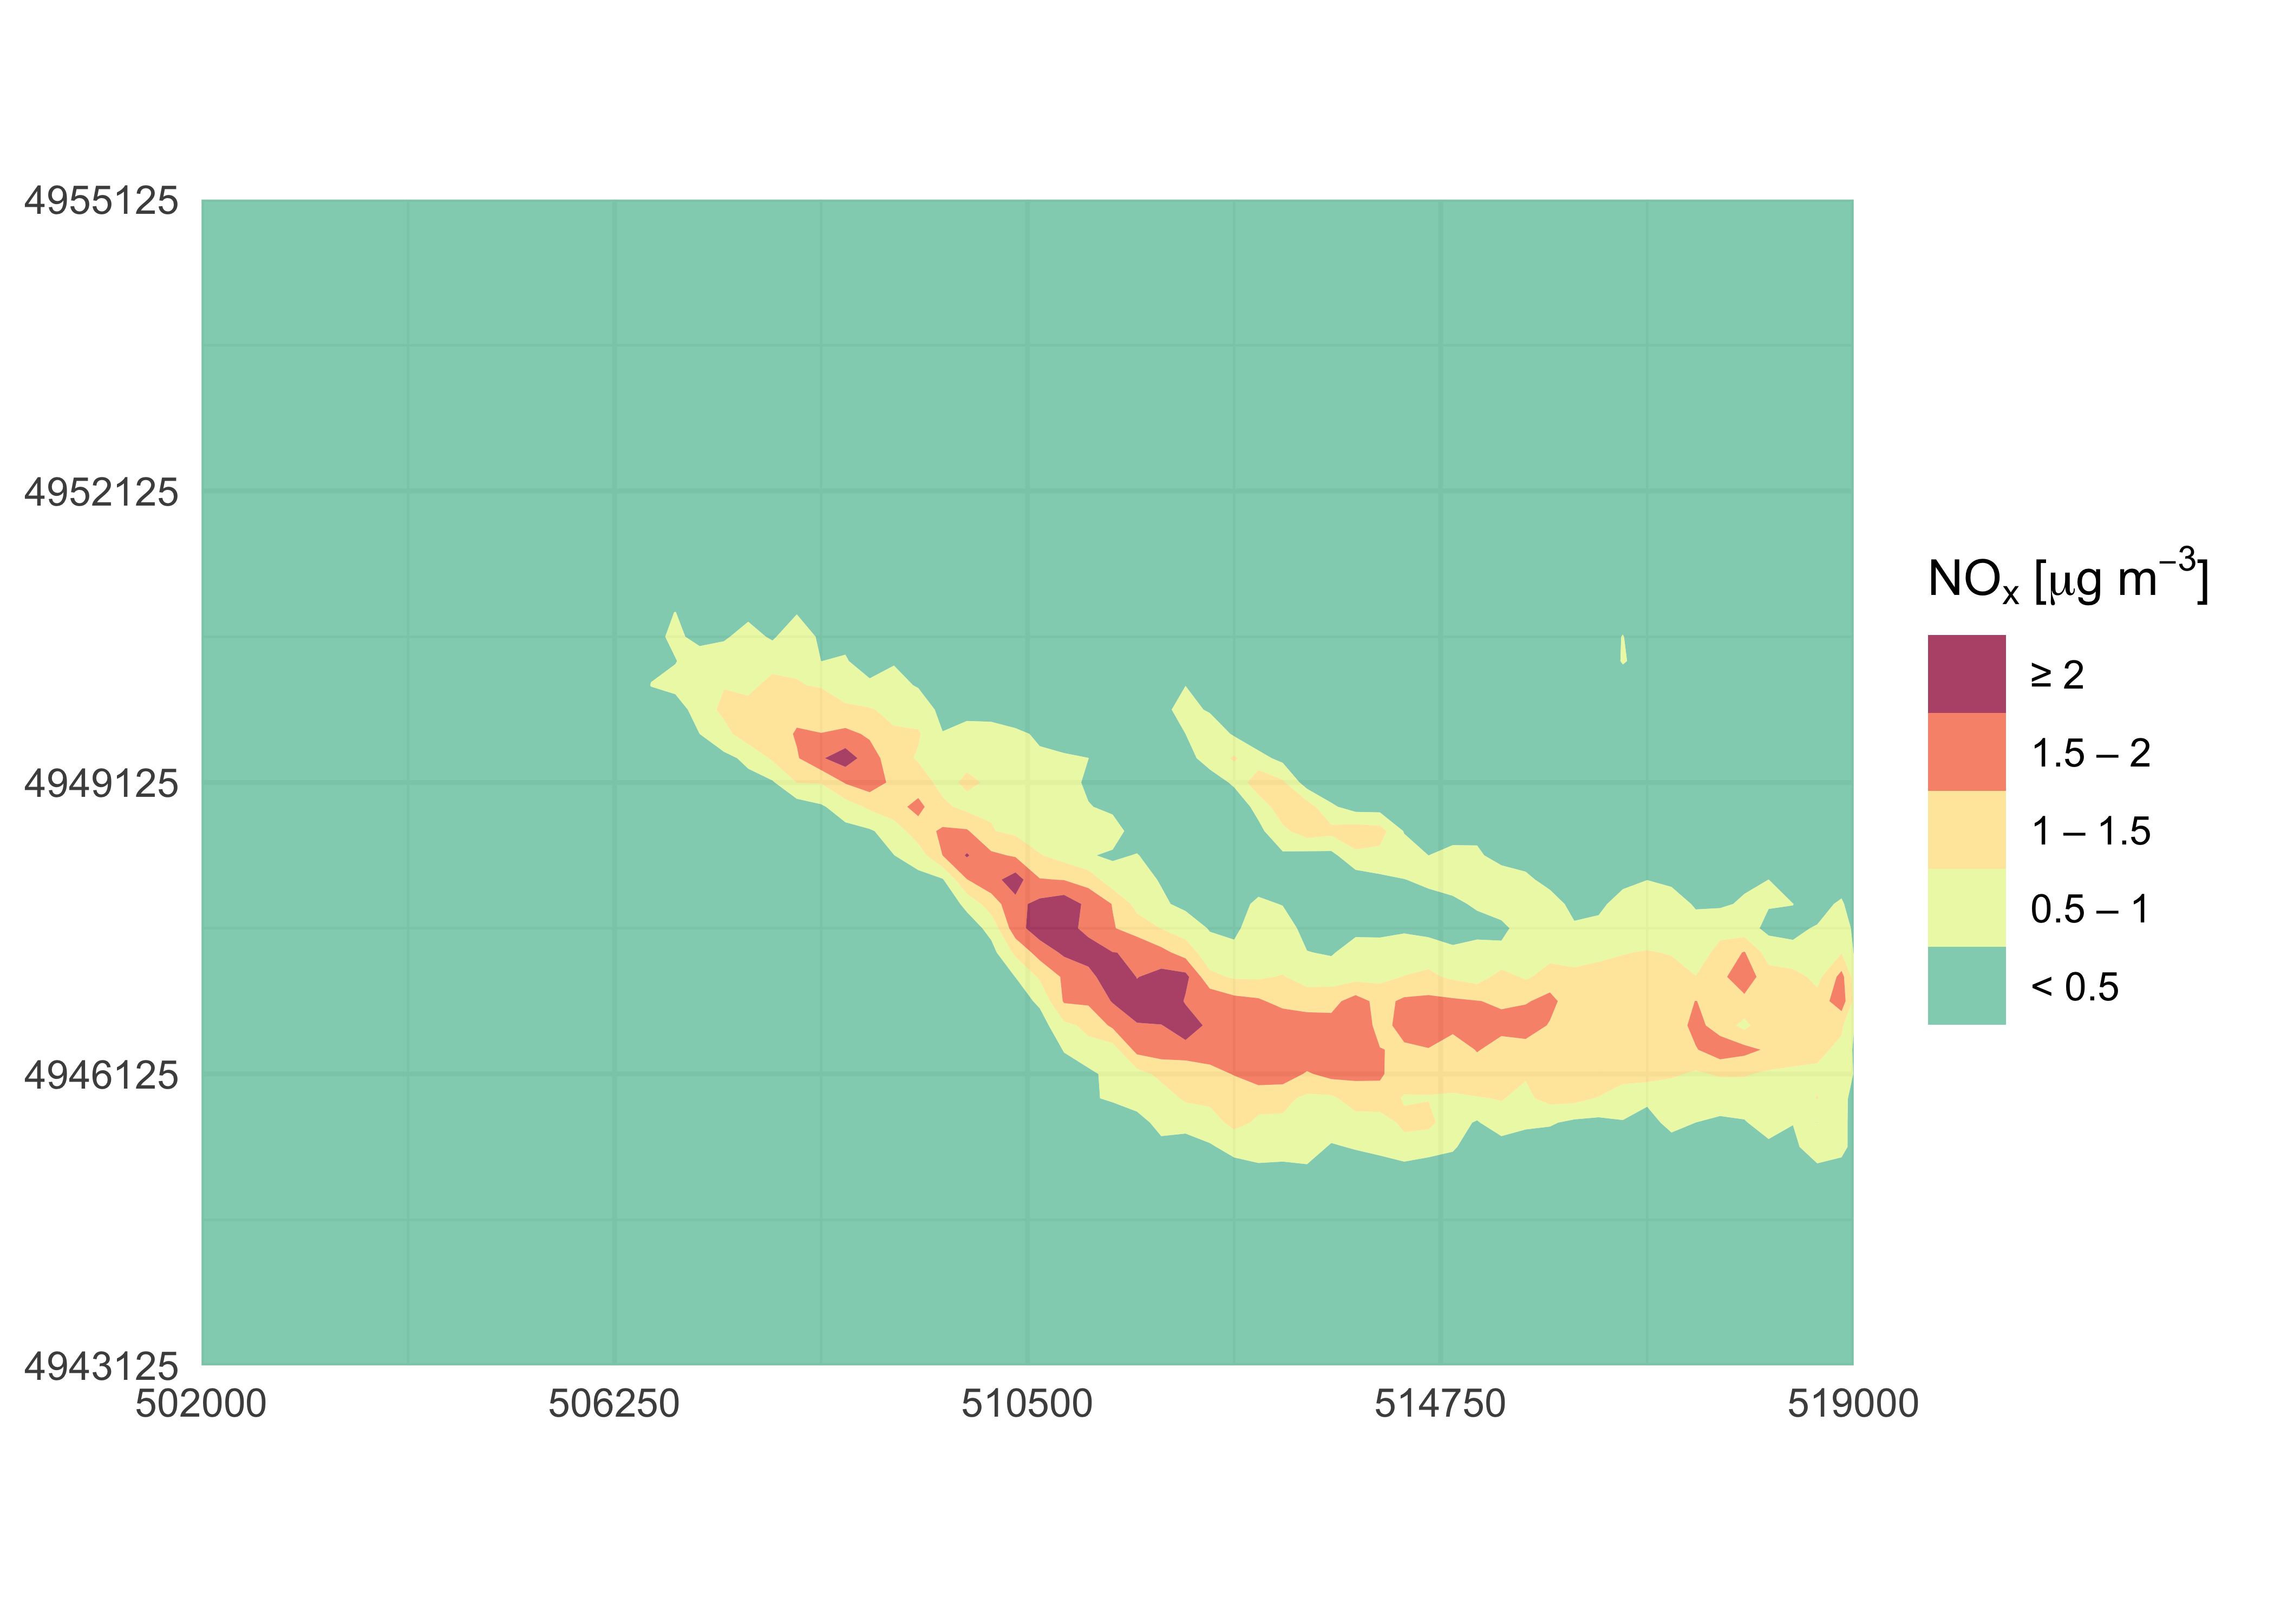
Use ggsave() to save the last plot to file:
If a tile plot is required:
library(ggplot2)
contourPlot2(mydata,
             tile = TRUE,
             legend = "NOx [ug/m3]") +
  labs(x = NULL, y = NULL) +
  theme_minimal()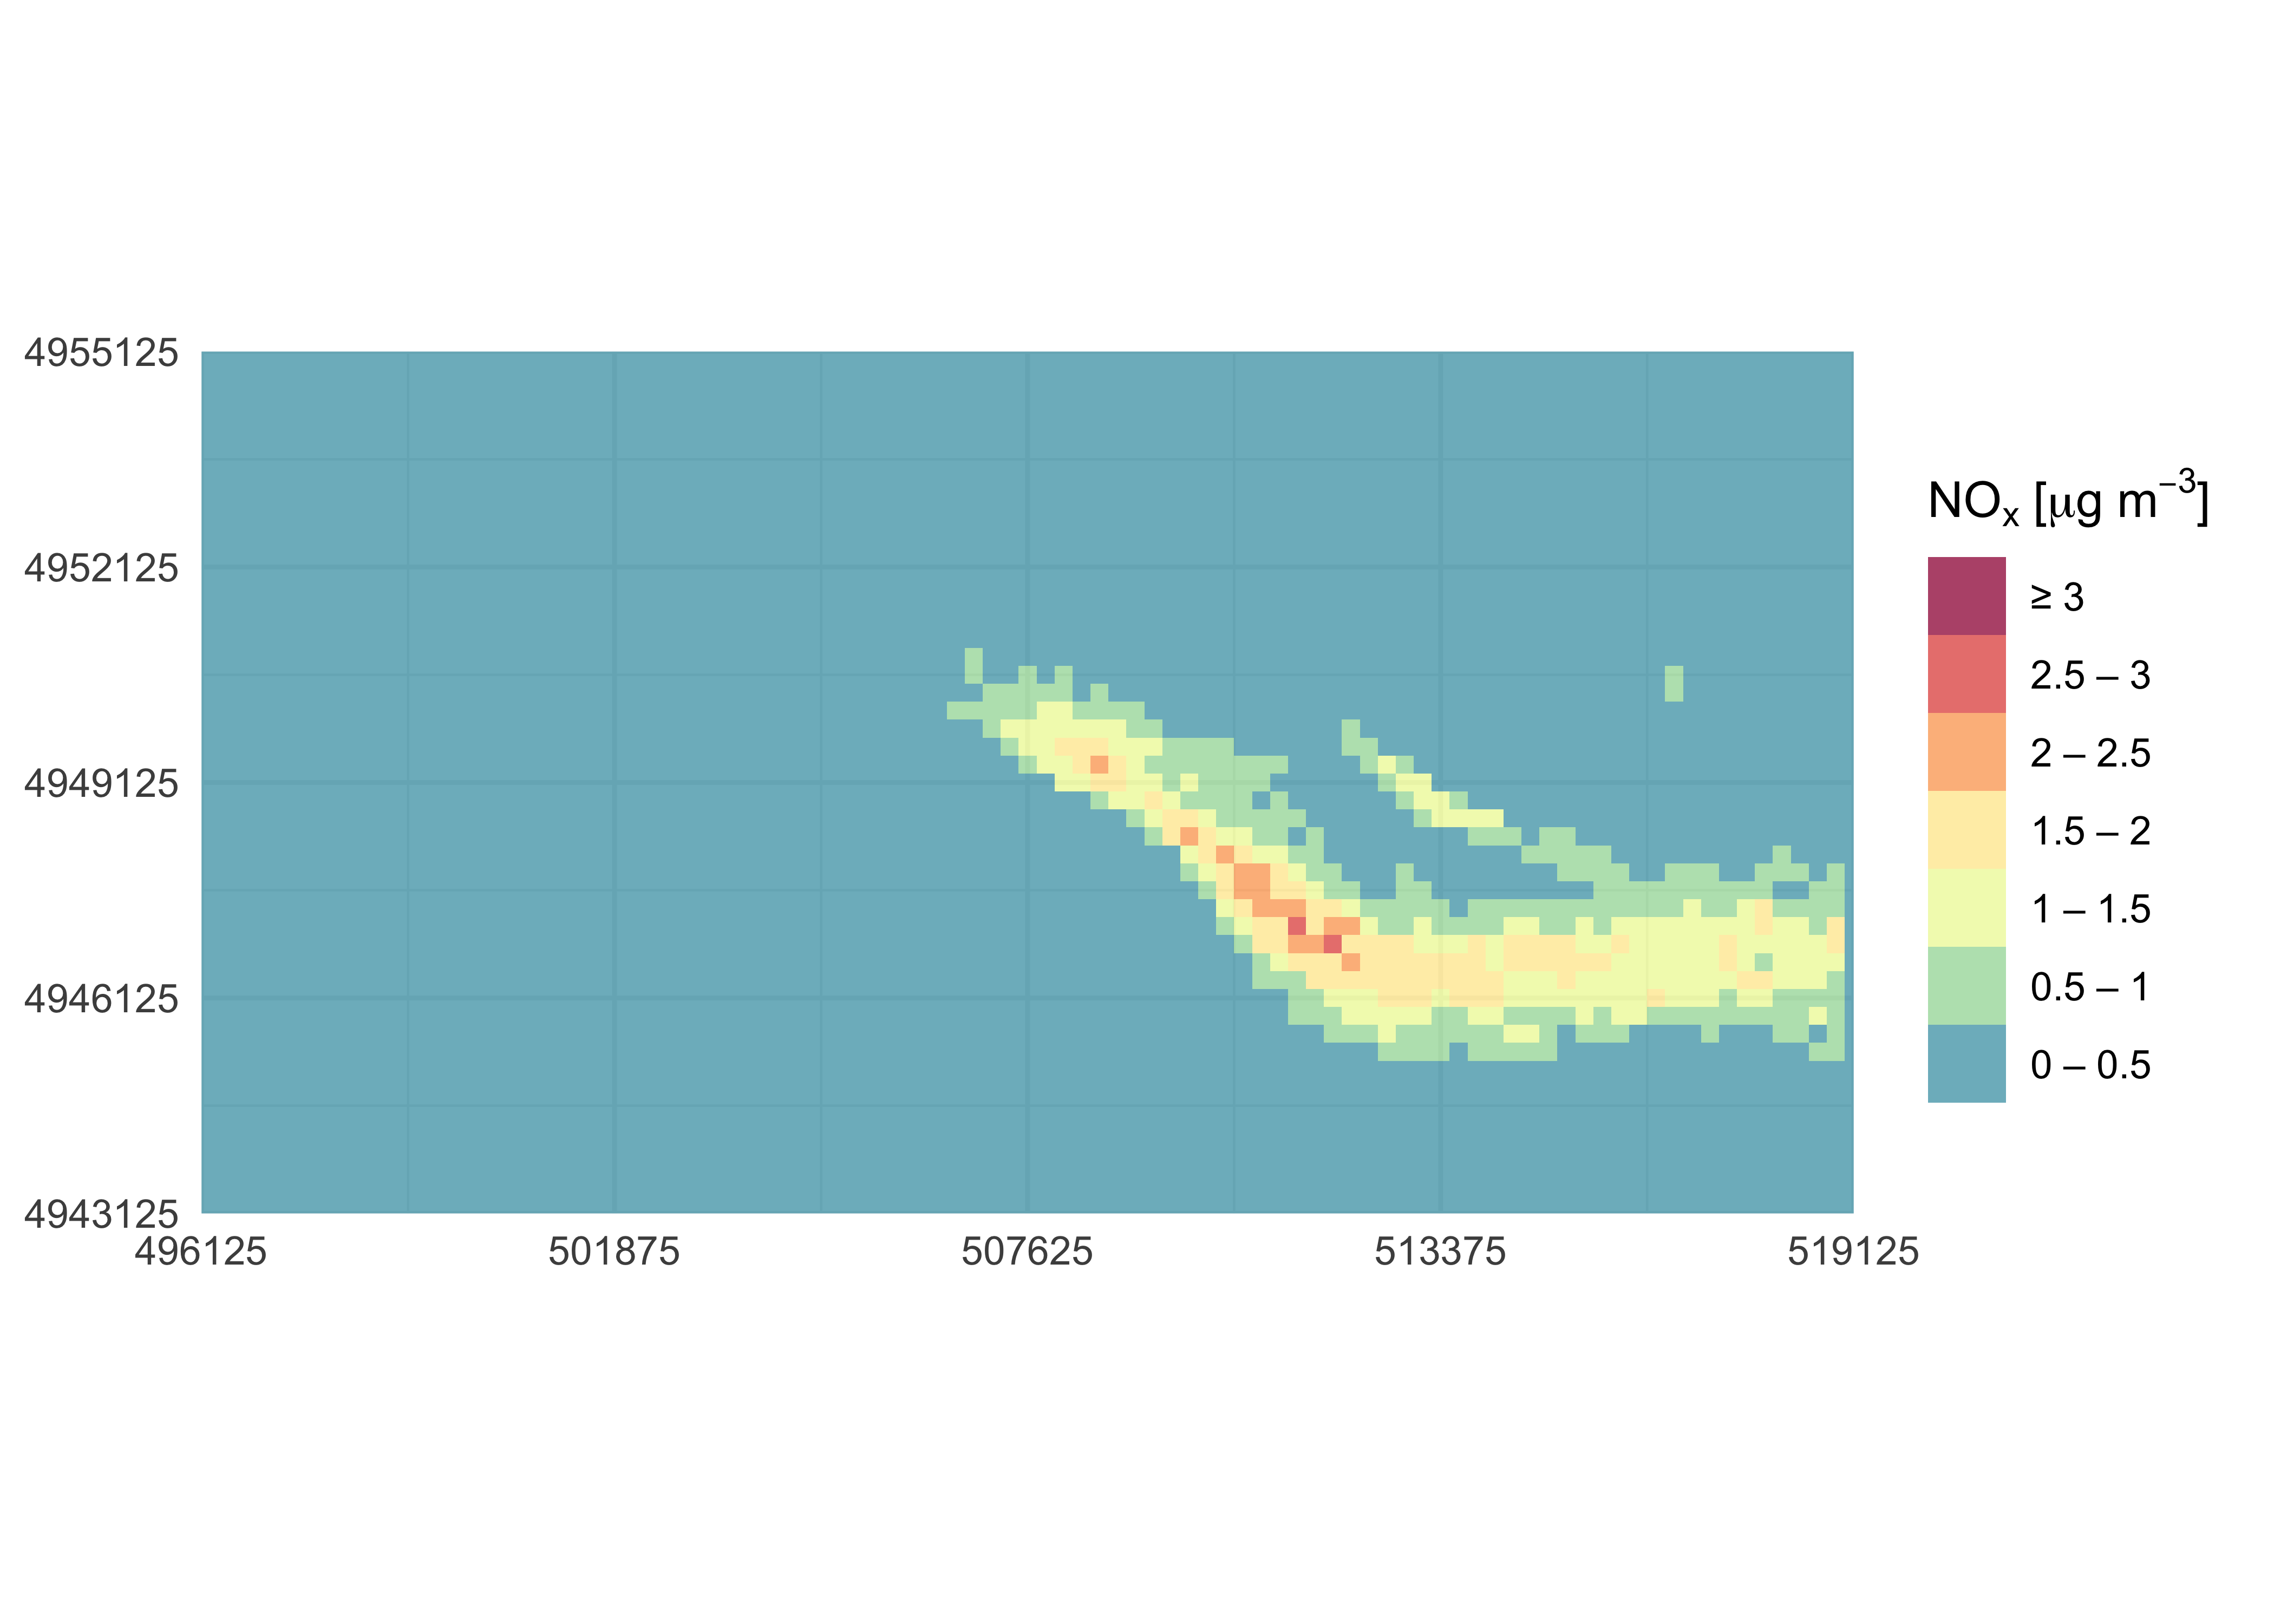
Available functions are listed below:
contpourPlot2()downloadBasemap()importRaster().importADSOBIN().importSurferGrd().plotAvgRad().plotAvgTemp().plotStabilityClass().removeOutliers().rollingMax().stabilityClass().vectorField().contourPlot() obsolete.createBaseMap() obsolete.Contact person:
Giuseppe Carlino
Simularia s.r.l.
g.carlino@simularia.itMatteo Paolo Costa