![]()
![]()
![]()
The goal of specr is to facilitate specification curve analyses (Simonsohn, Simmons & Nelson, 2019; also known as multiverse analyses, see Steegen, Tuerlinckx, Gelman & Vanpaemel, 2016). It can be used to investigate how different (theoretically plausible) analytical choices affect outcome statistics within the universe of one single data set.
It provides functions to setup, run, evaluate, and plot the multiverse of specifications. A simple usage example is provided below. For more information about the various functions and specific use cases, visit the documentation.
There are also some vignettes that exemplify and explain specific aspects and functions of the package:
We do see a lot of value in investigating how analytical choices affect a statistical outcome of interest. However, we strongly caution against using specr as a tool to somehow arrive at a better estimate. Running a specification curve analysis does not make your findings any more reliable, valid or generalizable than a single analysis. The method is only meant to inform about the effects of analytical choices on results, and not a better way to estimate a correlation or effect.
You can install the development version from GitHub with:
Using specr is comparatively simple. The main function is run_specs() in which analytical choices are specified as arguments. The function plot_specs() can then be used to visualize the results.
library(specr)

# Run specs
results <- run_specs(df = example_data,
                     y = c("y1", "y2"),
                     x = c("x1", "x2"),
                     model = c("lm"),
                     controls = c("c1", "c2"),
                     subsets = list(group1 = unique(example_data$group1),
                                    group2 = unique(example_data$group2)))
# Result frame
head(results)
#> # A tibble: 6 x 12
#>   x     y     model controls estimate std.error statistic  p.value conf.low
#>   <chr> <chr> <chr> <chr>       <dbl>     <dbl>     <dbl>    <dbl>    <dbl>
#> 1 x1    y1    lm    c1 + c2     4.95      0.525     9.43  3.11e-18    3.92
#> 2 x2    y1    lm    c1 + c2     6.83      0.321    21.3   1.20e-57    6.20
#> 3 x1    y2    lm    c1 + c2    -0.227     0.373    -0.607 5.44e- 1   -0.961
#> 4 x2    y2    lm    c1 + c2     0.985     0.324     3.04  2.62e- 3    0.347
#> 5 x1    y1    lm    c1          5.53      0.794     6.97  2.95e-11    3.96
#> 6 x2    y1    lm    c1          8.07      0.557    14.5   6.90e-35    6.98
#> # … with 3 more variables: conf.high <dbl>, obs <int>, subsets <chr>

# Plot
plot_specs(results, choices = c("x", "y", "controls", "subsets"))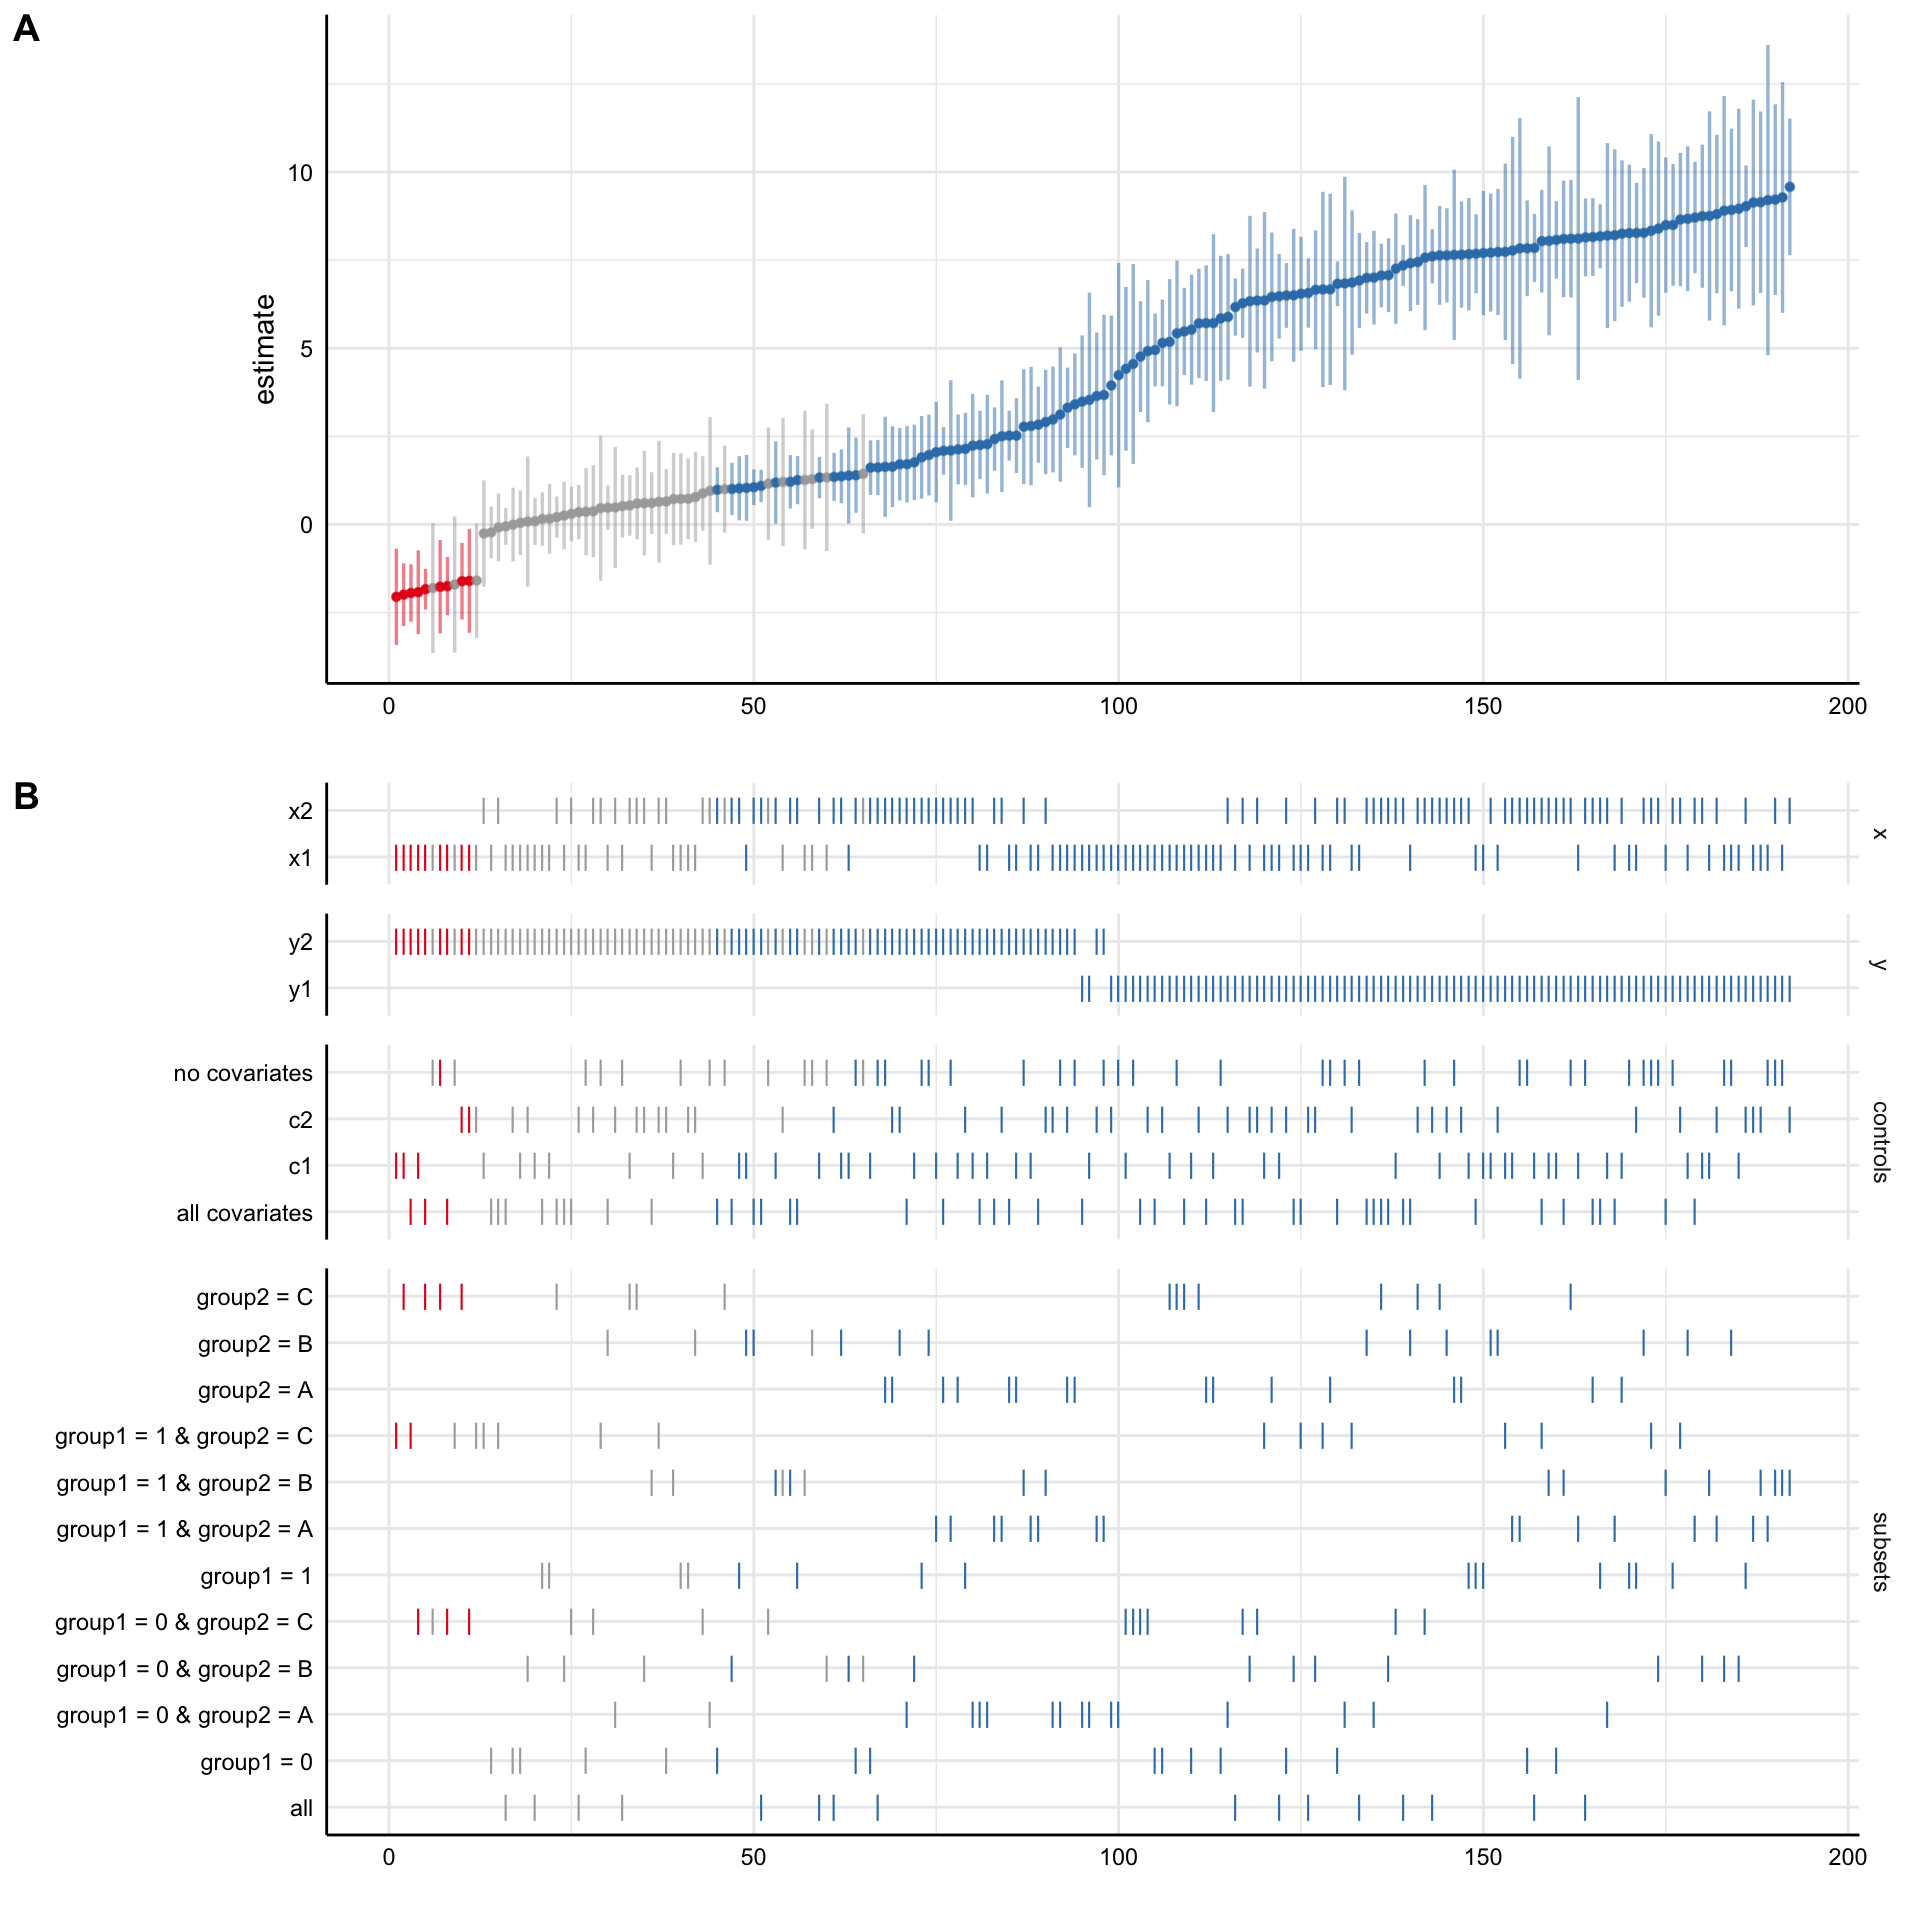
citation("specr")
#>
#> To cite 'specr' in publications use:
#>
#>   Masur, Philipp K. & Scharkow, M. (2019). specr: Statistical functions
#>   for conducting specification curve analyses. Available from
#>   https://github.com/masurp/specr.
#>
#> A BibTeX entry for LaTeX users is
#>
#>   @Misc{,
#>     title = {specr: Statistical functions for conducting specification curve analyses (Version 0.2.0)},
#>     author = {Philipp K. Masur and Michael Scharkow},
#>     year = {2019},
#>     url = {https://github.com/masurp/specr},
#> }Simonsohn, U., Simmons, J. P., & Nelson, L. D. (2019). Specification Curve: Descriptive and Inferential Statistics for all Plausible Specifications. Available at: https://doi.org/10.2139/ssrn.2694998
Steegen, S., Tuerlinckx, F., Gelman, A., & Vanpaemel, W. (2016). Increasing Transparency Through a Multiverse Analysis. Perspectives on Psychological Science, 11(5), 702-712. https://doi.org/10.1177/1745691616658637