The goal of the success package is to allow easy applications of continuous time CUSUM procedures on survival data. Specifically, the Biswas & Kalbfleisch CUSUM (2008) and the CGR-CUSUM (2021).
Besides this, it allows for the construction of the Binary CUSUM chart and funnel plot on survival data as well.
You can install the released version of success from CRAN with:
And the development version from GitHub with:
This is a basic example which shows you how to construct a CGR-CUSUM chart on a hospital from the attached data set “surgerydat”:
library(success)
#> Loading required package: ggplot2
#> Loading required package: pbapply
#> Warning: package 'pbapply' was built under R version 4.1.2
library(survival)
tdat <- subset(surgerydat, hosp_num == 1)
tcbaseh <- function(t) chaz_exp(t, lambda = 0.01)
exprfit <- as.formula("Surv(survtime, censorid) ~ age + sex + BMI" )
tcoxmod <- coxph(exprfit, data= surgerydat)
#Alternatively, cbaseh can be left empty when specifying coxphmod through coxph()
cgr <- cgr_cusum(data = tdat, coxphmod = tcoxmod, cbaseh = tcbaseh, pb = TRUE)
#> Step 1/2: Determining hazard contributions.
#> Step 2/2: Determining chart values.
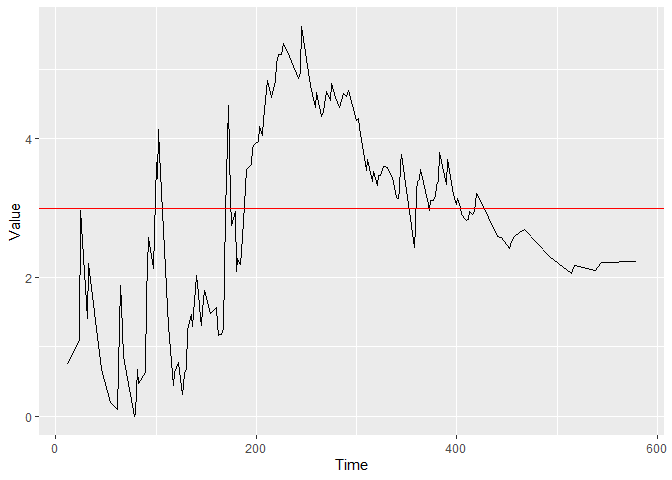
plot(cgr)
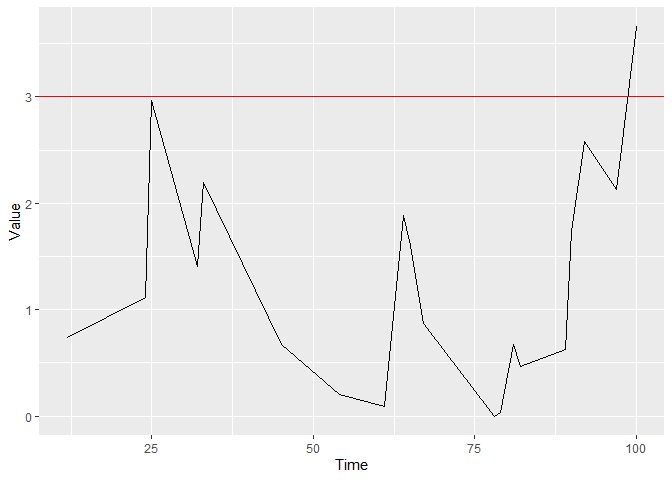
You can plot the figure with control limit h = 3 by using:
And determine the runlength of the chart when using control limit h = 4:
Hospital 1 would be detected by a CGR-CUSUM with control limit h = 4 after 102 days.
Alternatively, you can construct the CGR-CUSUM only until it crosses control limit h = 3 by:
cgr <- cgr_cusum(data = tdat, coxphmod = tcoxmod, cbaseh = tcbaseh, pb = TRUE, h = 3)
#> Step 1/2: Determining hazard contributions.
#> Step 2/2: Determining chart values.
plot(cgr)