![]()
![]()

The goal of {tidyterra} is to provide common methods of the tidyverse packages for objects created with the {terra} package: SpatRaster and SpatVector. It also provides geoms for plotting these objects with {ggplot2}.
{tidyverse} methods implemented on {tidyterra} works differently depending on the type of Spat* object:
SpatVector: the methods are implemented taking advantage of the
tidyverse implementation on {sf}. The SpatVector object is converted
first to sf via sf::st_as_sf(), then the method (or
function) is applied and finally the object is converted back to
SpatVector with terra::vect(). Hence, rows correspond to
geometries and columns correspond to attributes of the
geometry.
SpatRaster: The implementation on SpatRaster objects differs,
since the methods could be applied to layers or to cells. {tidyterra}
overall approach is to treat the layers as columns of a tibble and the
cells as rows (i.e. select(SpatRaster, 1) would select the
first layer of a SpatRaster).
The methods implemented return the same type of object used as input,
unless the expected behavior of the method is to return another type of
object, (for example, as_tibble() would return a
tibble).
Current methods and functions provided by {tidyterra} are:
| tidyverse method | SpatVector | SpatRaster |
|---|---|---|
tibble::as_tibble() |
:heavy_check_mark: | :heavy_check_mark: |
dplyr::select() |
:heavy_check_mark: | :heavy_check_mark: Select layers |
dplyr::mutate() |
:heavy_check_mark: | :heavy_check_mark: Create /modify layers |
dplyr::transmute() |
:heavy_check_mark: | :heavy_check_mark: |
dplyr::filter() |
:heavy_check_mark: | :heavy_check_mark: Modify cells values and (additionally) remove outer cells. |
dplyr::slice() |
:heavy_check_mark: | :heavy_check_mark: Additional methods for slicing by row and column. |
dplyr::pull() |
:heavy_check_mark: | :heavy_check_mark: |
dplyr::rename() |
:heavy_check_mark: | :heavy_check_mark: |
dplyr::relocate() |
:heavy_check_mark: | :heavy_check_mark: |
tidyr::drop_na() |
:heavy_check_mark: | :heavy_check_mark: Remove cell values with NA on any
layer. Additionally, outer cells with NA are removed. |
tidyr::replace_na() |
:heavy_check_mark: | :heavy_check_mark: |
ggplot2::geom_*() |
:heavy_check_mark: geom_spatvector() |
:heavy_check_mark: geom_spatraster() and
geom_spatraster_rgb(). |
{tidyterra} is conceived as a user-friendly wrapper of {terra} using the {tidyverse} methods and verbs. This approach therefore has a cost in terms of performance.
If you are a heavy user of {terra} or you need to work with big raster files, {terra} is much more focused on terms of performance. When possible, each function of {tidyterra} references to its equivalent on {terra}.
As a rule of thumb if your raster has less than 10.000.000 data slots
counting cells and layers
(i.e. terra::ncell(your_rast)*terra::nlyr(your_rast) < 10e6)
you are good to go with {tidyterra}.
When plotting rasters, resampling is performed automatically (as
terra::plot() does, see the help page). You can adjust this
with the maxcell parameter.
Install {tidyterra} from CRAN:
install.packages("tidyterra")You can install the development version of {tidyterra} like so:
remotes::install_github("dieghernan/tidyterra")Alternatively, you can install {tidyterra} using the r-universe:
# Enable this universe
options(repos = c(
  dieghernan = "https://dieghernan.r-universe.dev",
  CRAN = "https://cloud.r-project.org"
))
install.packages("tidyterra")This is a basic example which shows you how to manipulate and plot SpatRaster objects:
library(tidyterra)

library(terra)


# Temperatures
f <- system.file("extdata/cyl_temp.tif", package = "tidyterra")

rastertemp <- rast(f)

library(ggplot2)

# Facet all layers

ggplot() +
  geom_spatraster(data = rastertemp) +
  facet_wrap(~lyr, ncol = 2) +
  scale_fill_whitebox_c(
    palette = "muted",
    labels = scales::label_number(suffix = "º")
  ) +
  labs(fill = "Avg temperature")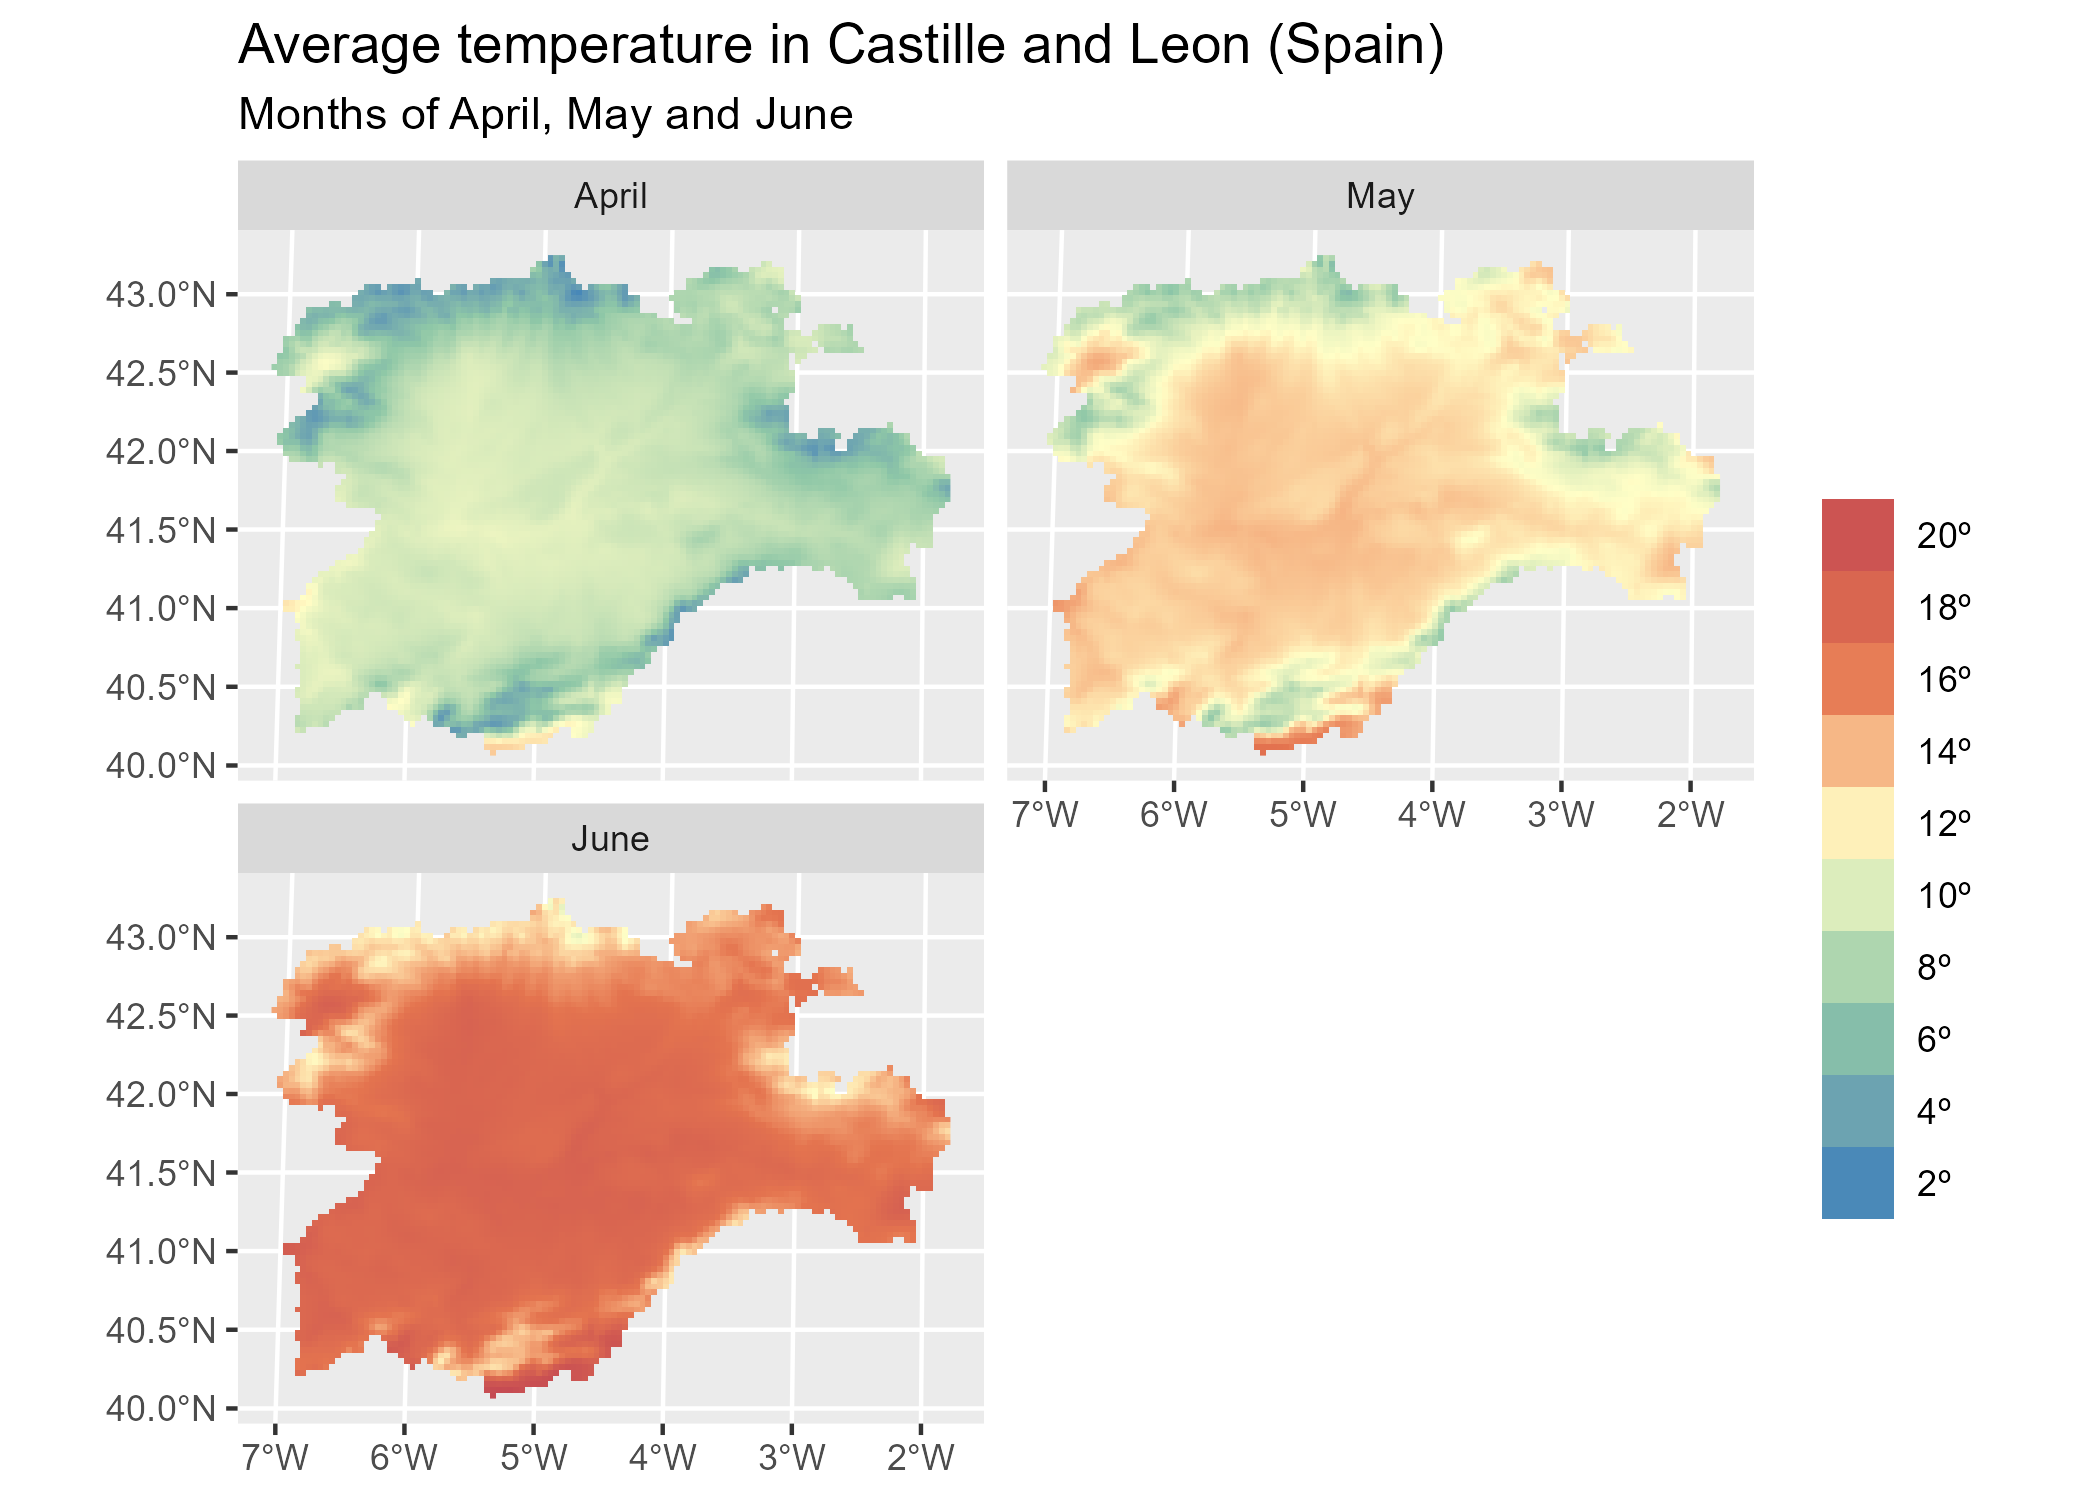
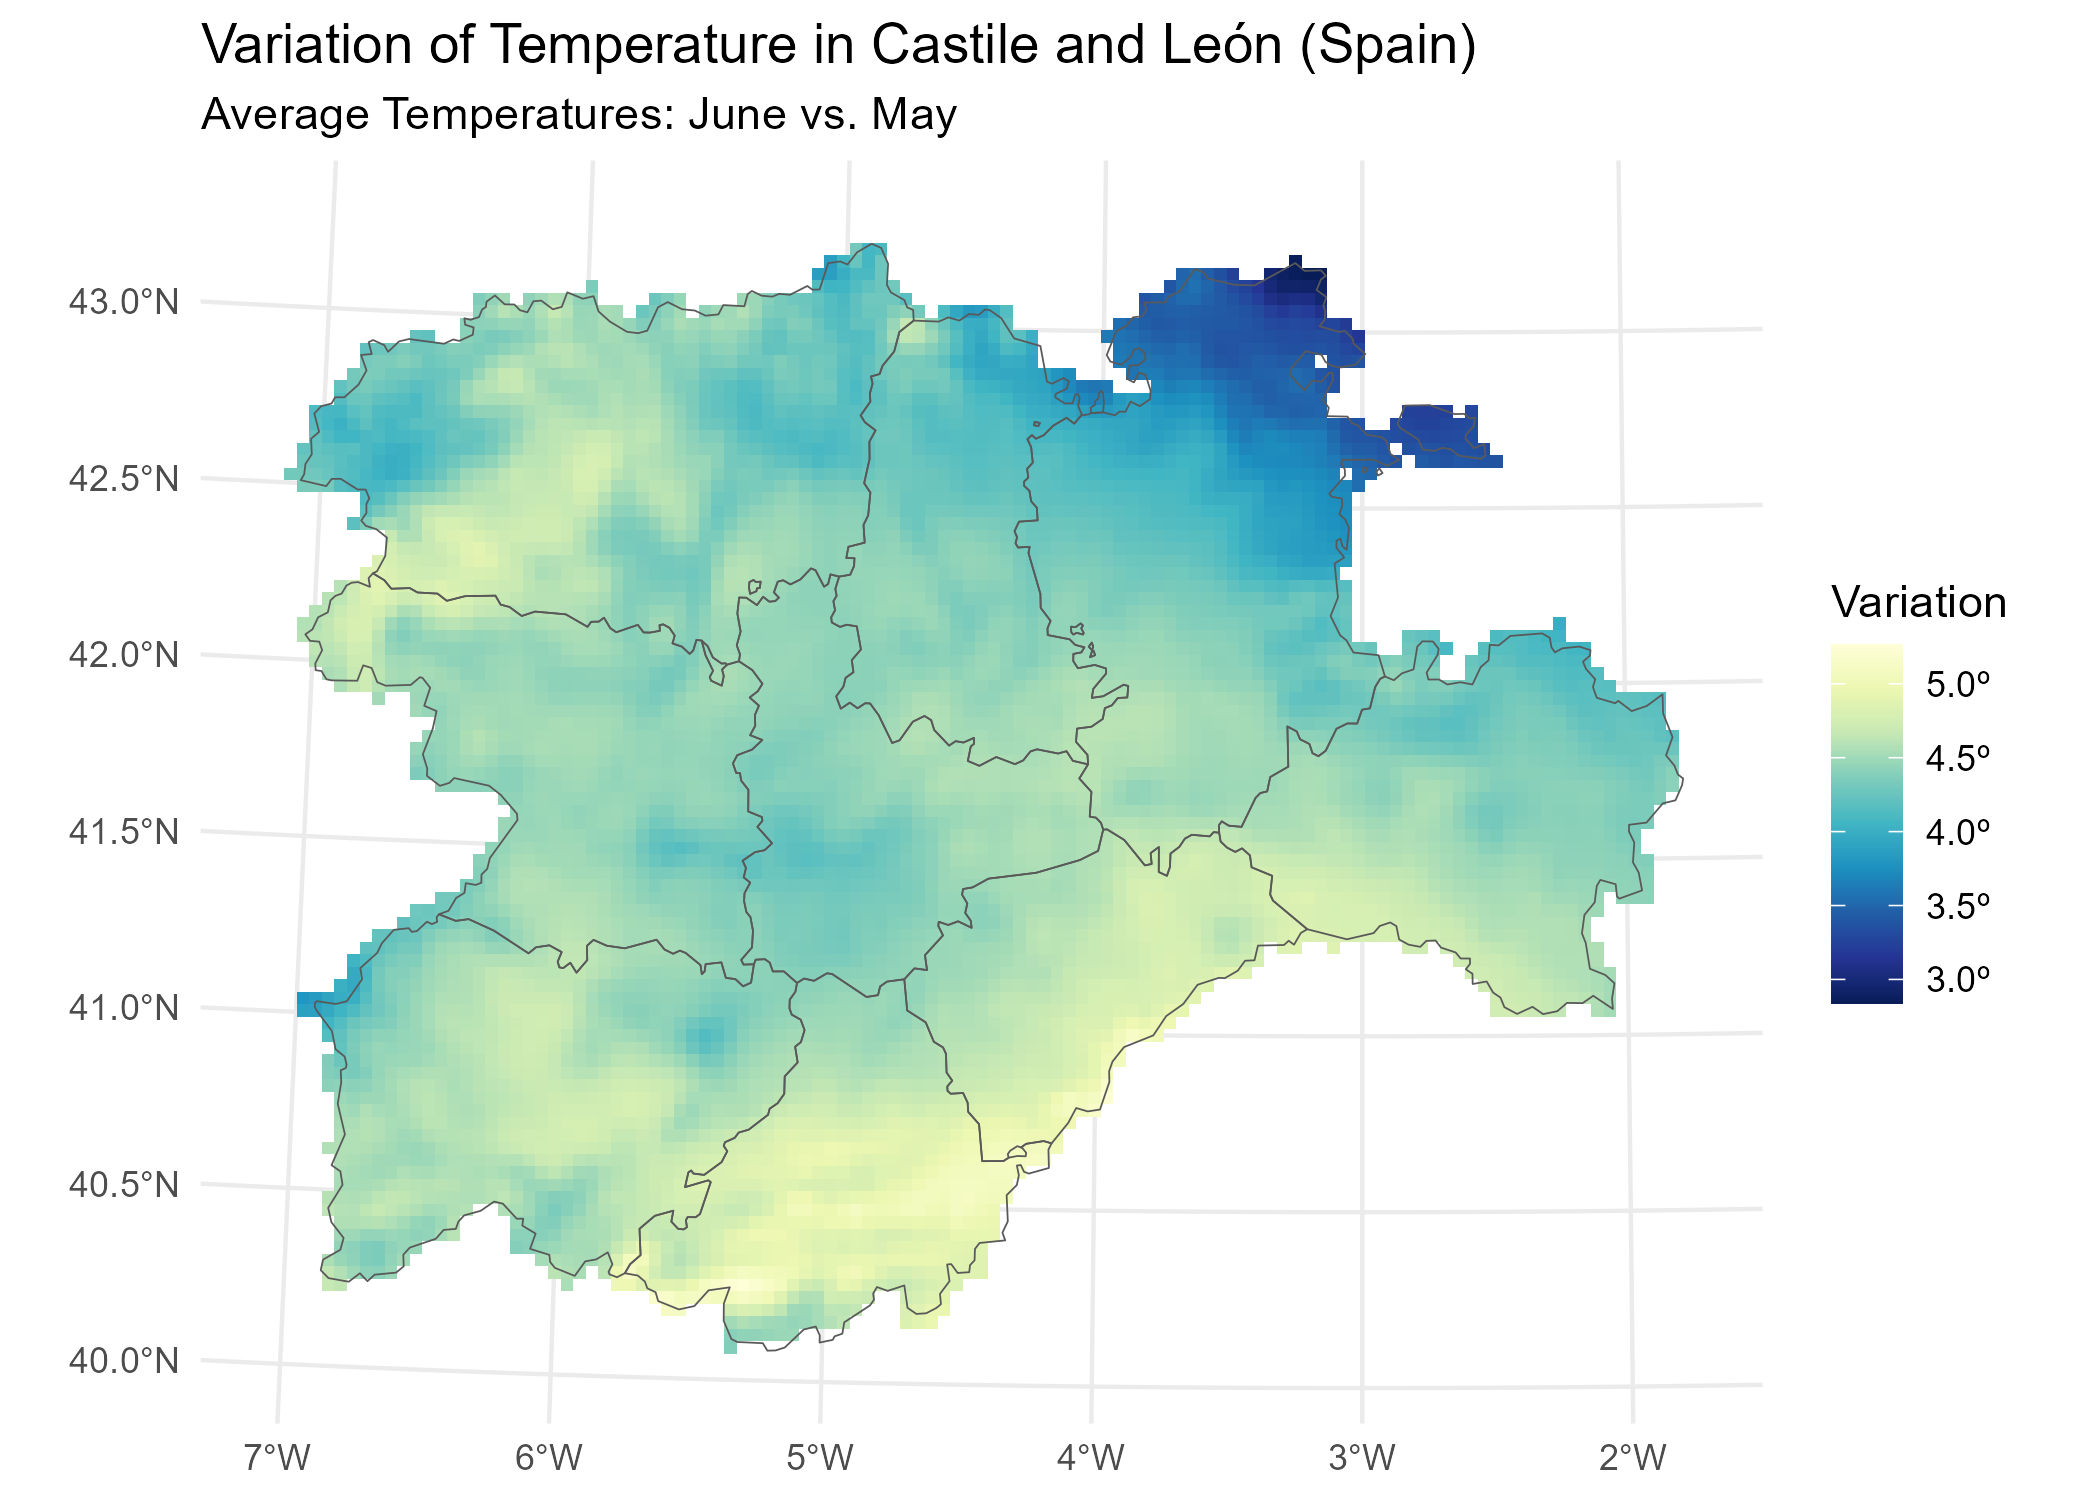
# Create maximum differences

variation <- rastertemp %>%
  mutate(
    diff = tavg_06 - tavg_04
  ) %>%
  select(var_apr_jun = diff)

# Add also a overlay of a SpatVector
f_vect <- system.file("extdata/cyl.gpkg", package = "tidyterra")

prov <- vect(f_vect)

ggplot() +
  geom_spatraster(data = variation) +
  geom_spatvector(data = prov, fill = NA) +
  scale_fill_whitebox_c(
    palette = "deep", direction = -1,
    labels = scales::label_number(suffix = "º")
  ) +
  theme_minimal() +
  coord_sf(crs = 25830) +
  labs(
    fill = "Difference",
    title = "Variation of temperature in Castille and Leon (Spain)",
    subtitle = "(Average) temperatures in June vs. April"
  )
{tidyterra} also provide a geom for plotting RGB SpatRaster tiles with {ggplot2}
f_tile <- system.file("extdata/cyl_tile.tif", package = "tidyterra")

rgb_tile <- rast(f_tile)


ggplot() +
  geom_spatraster_rgb(data = rgb_tile) +
  geom_spatvector(data = prov, fill = NA) +
  theme_light()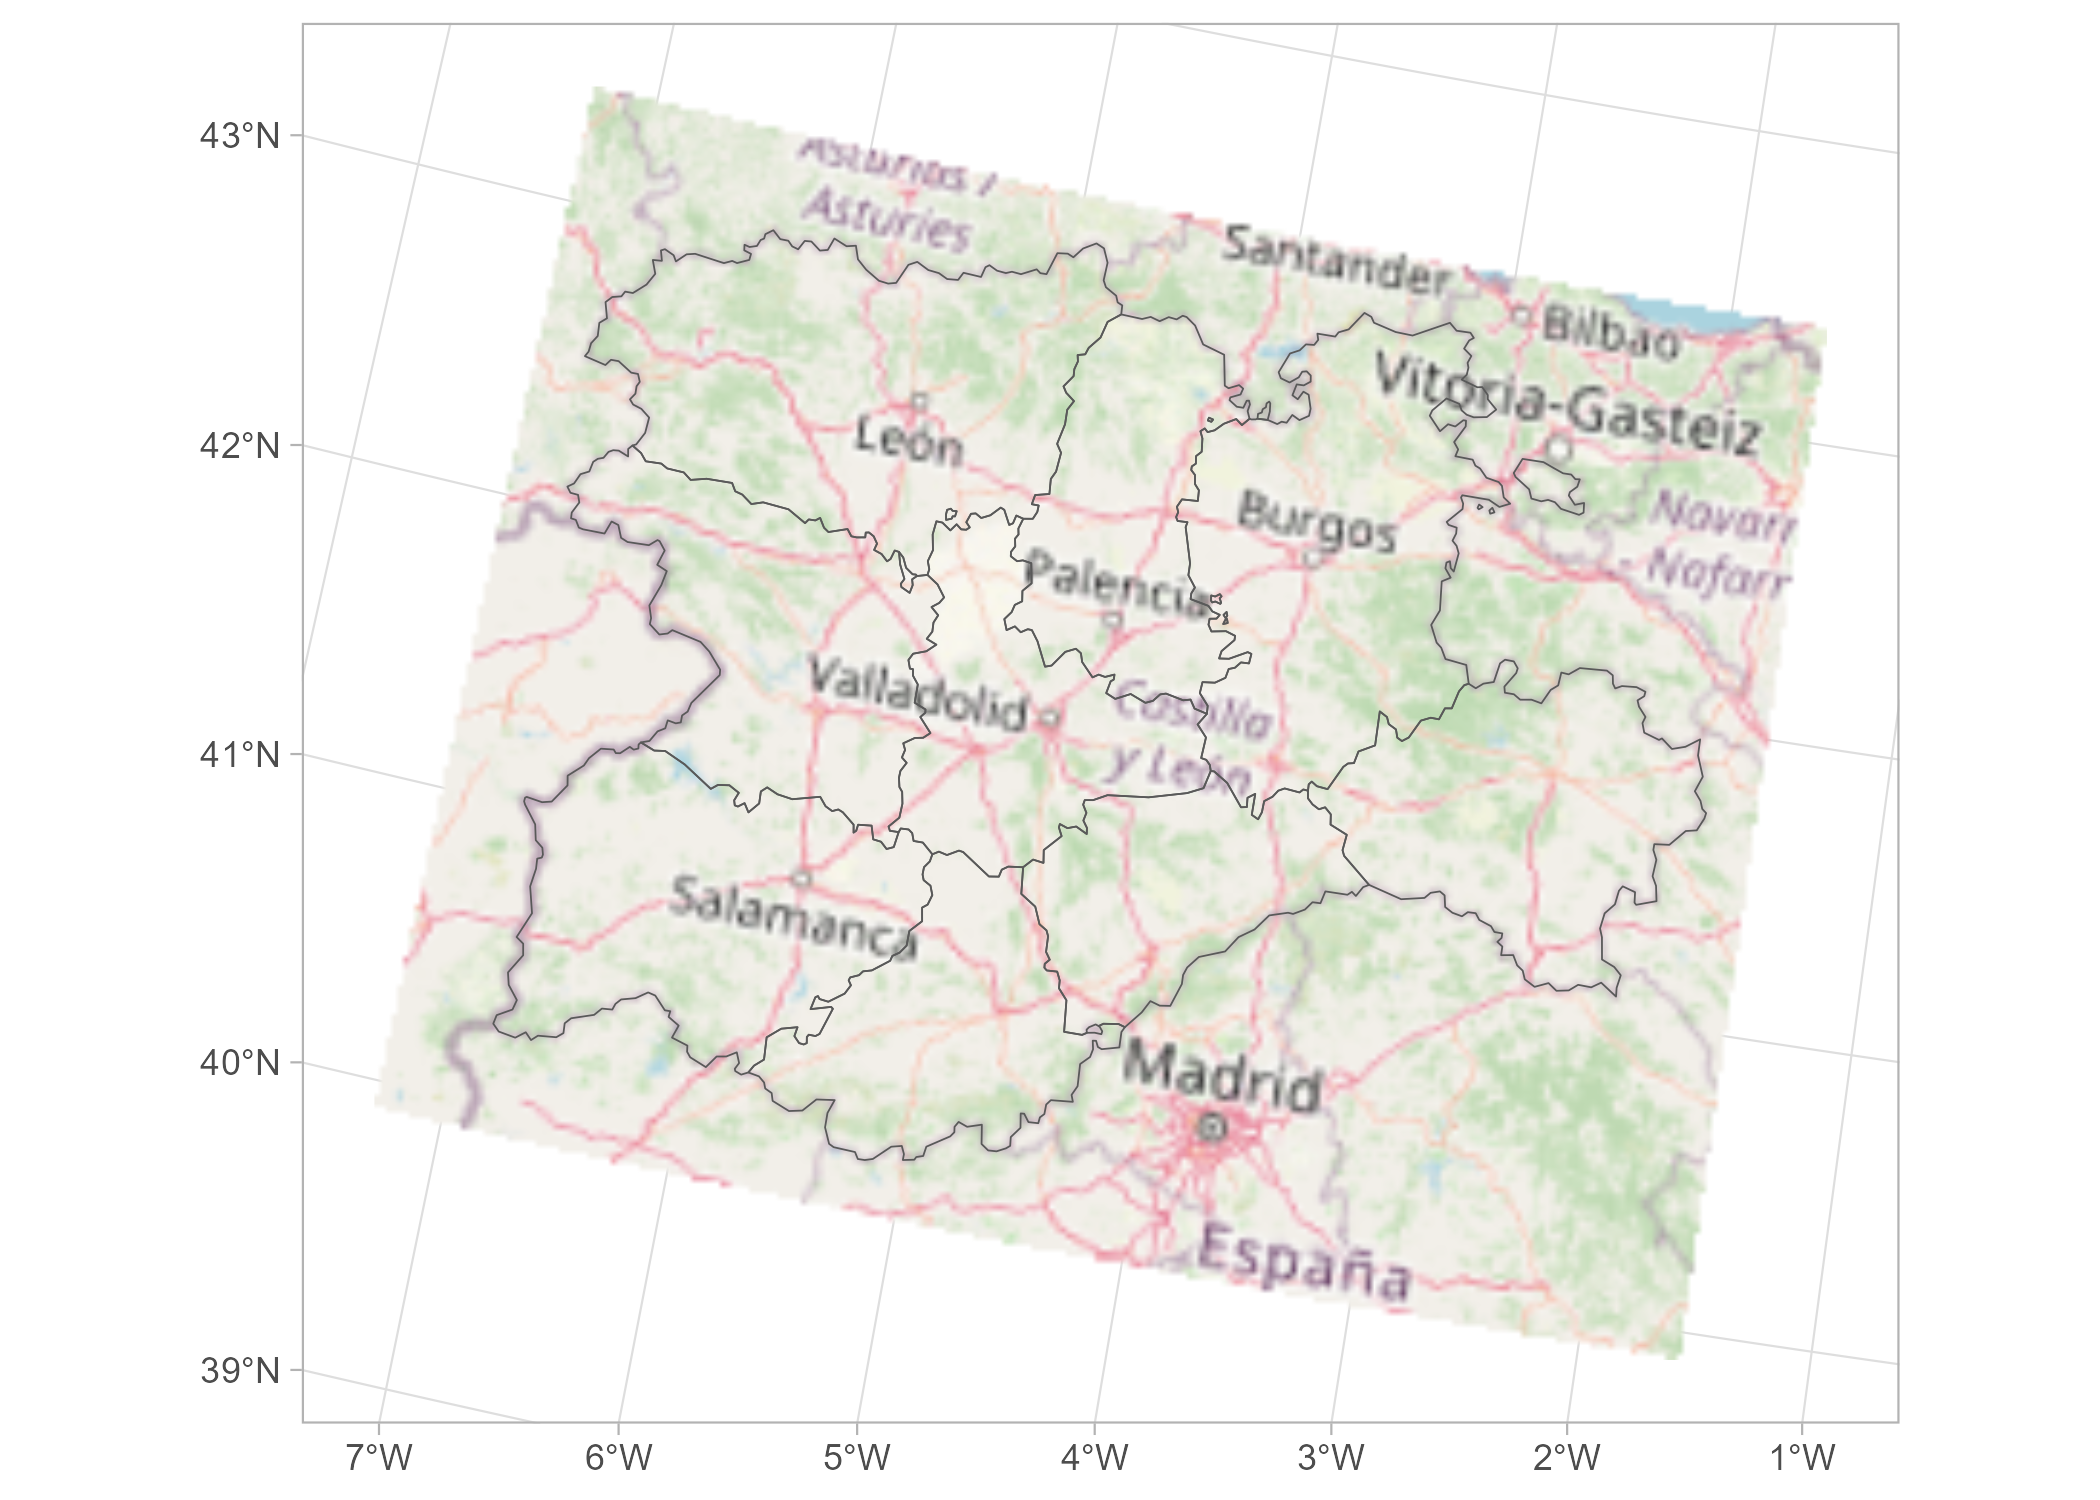
# Recognizes coord_sf()

ggplot() +
  geom_spatraster_rgb(data = rgb_tile) +
  geom_spatvector(data = prov, fill = NA) +
  theme_light() +
  # Change crs and datum (for relabeling graticules)
  coord_sf(crs = 3035, datum = 3035)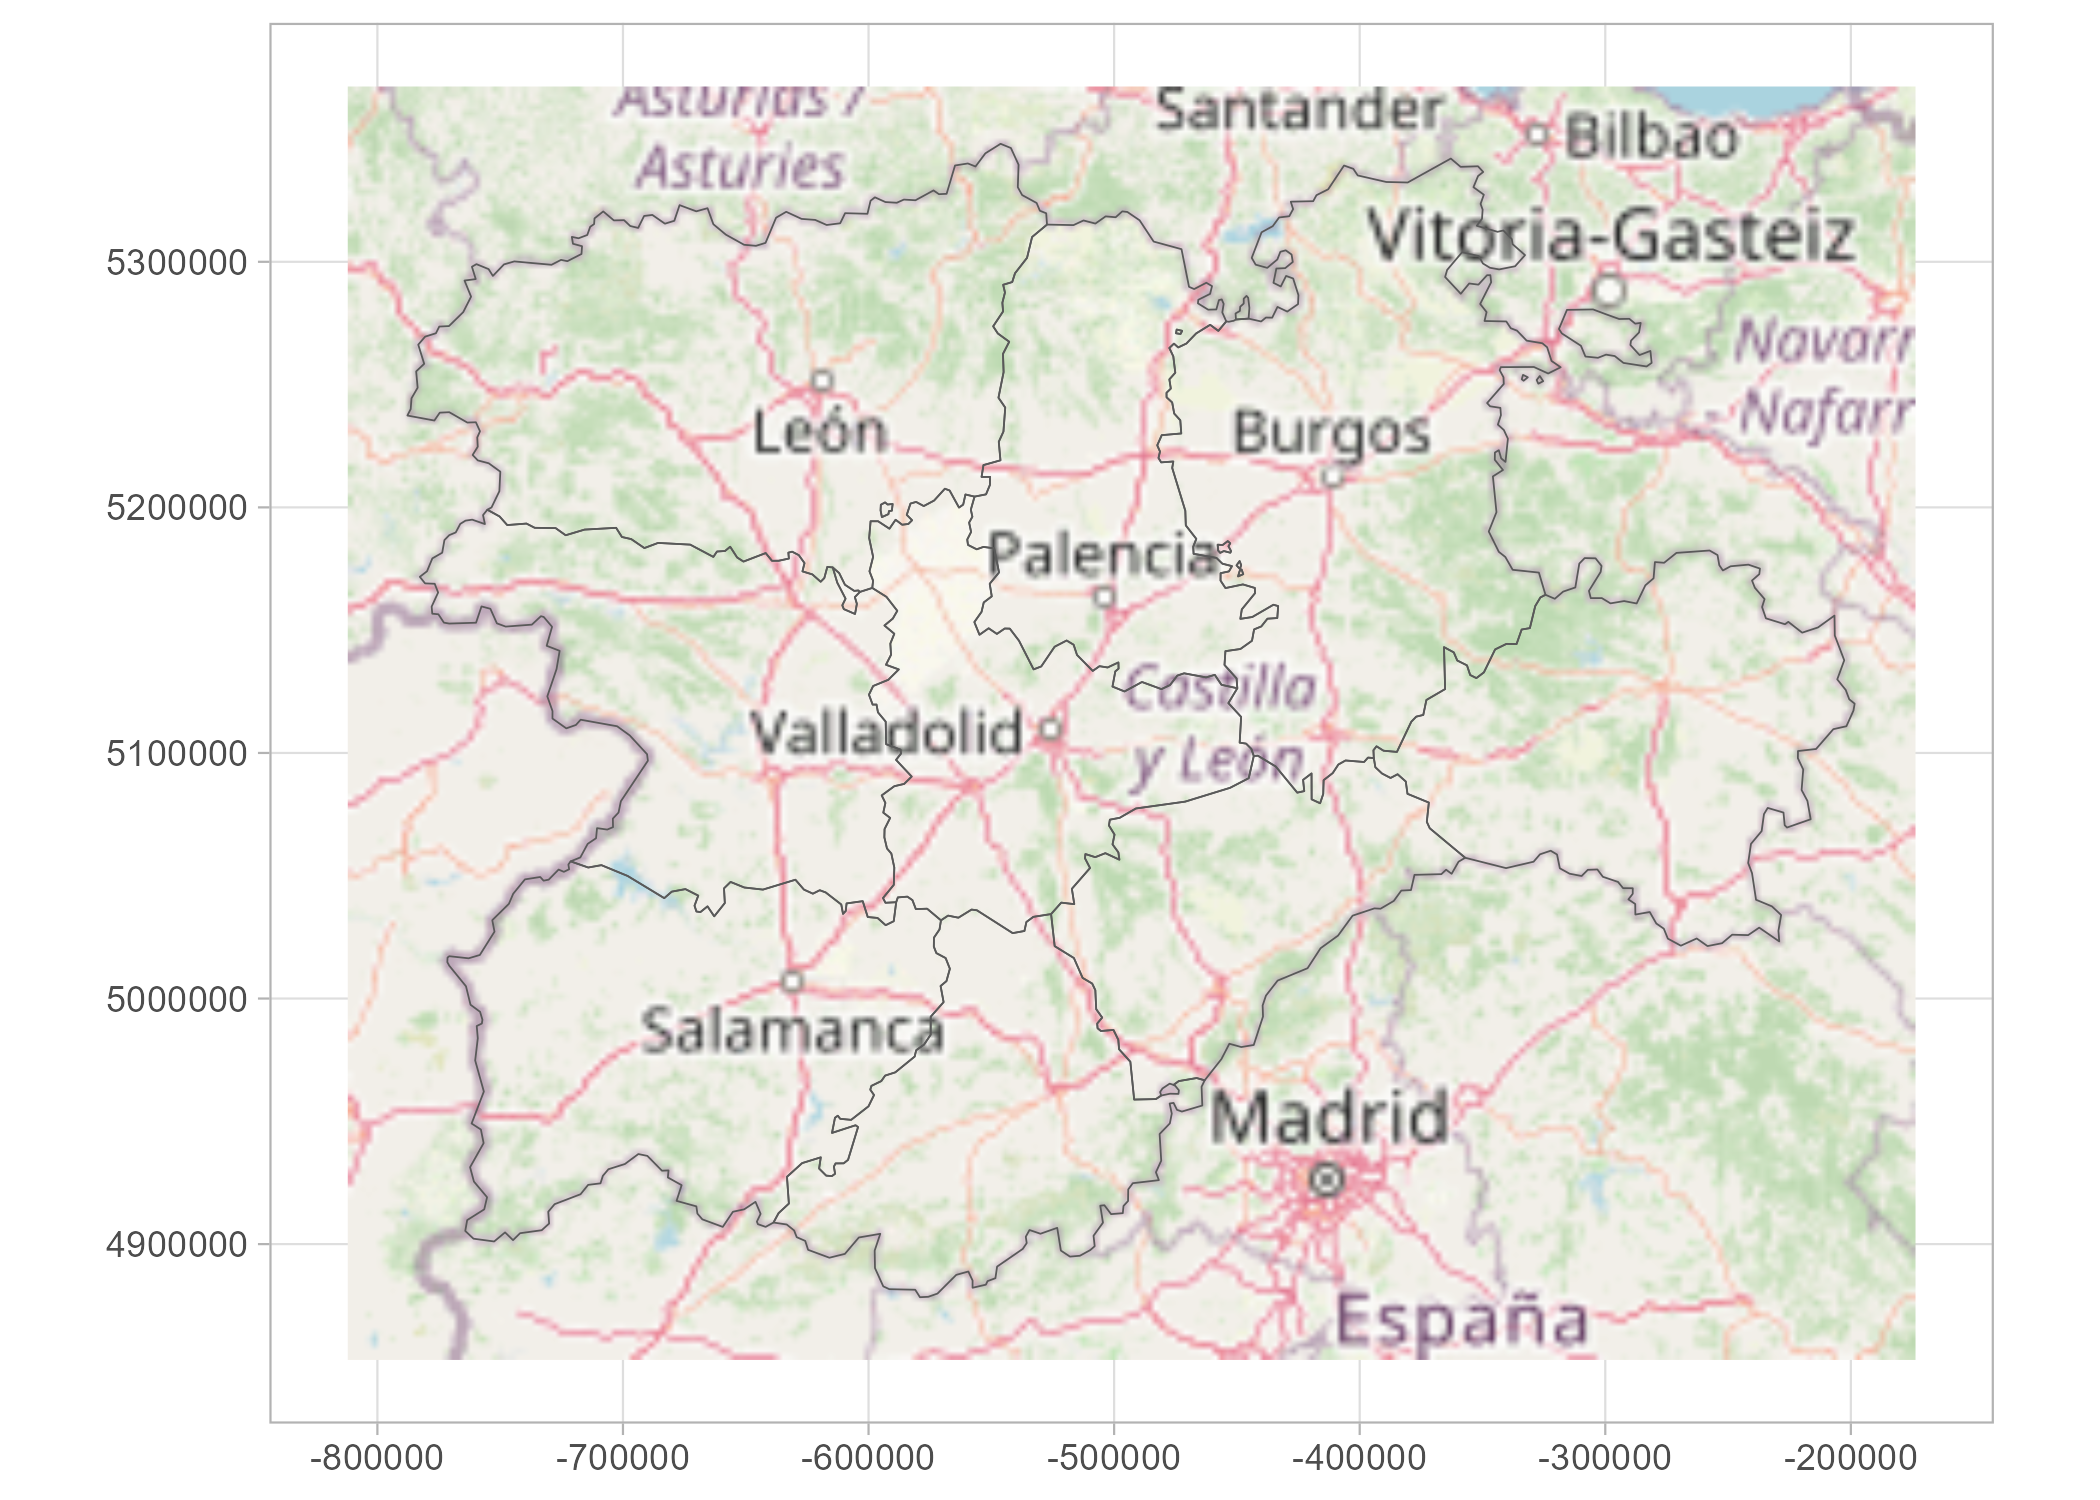
{tidyterra} provides specific scales for plotting hypsometric maps with {ggplot2}:
asia <- rast(system.file("extdata/asia.tif", package = "tidyterra"))

terra::plot(asia)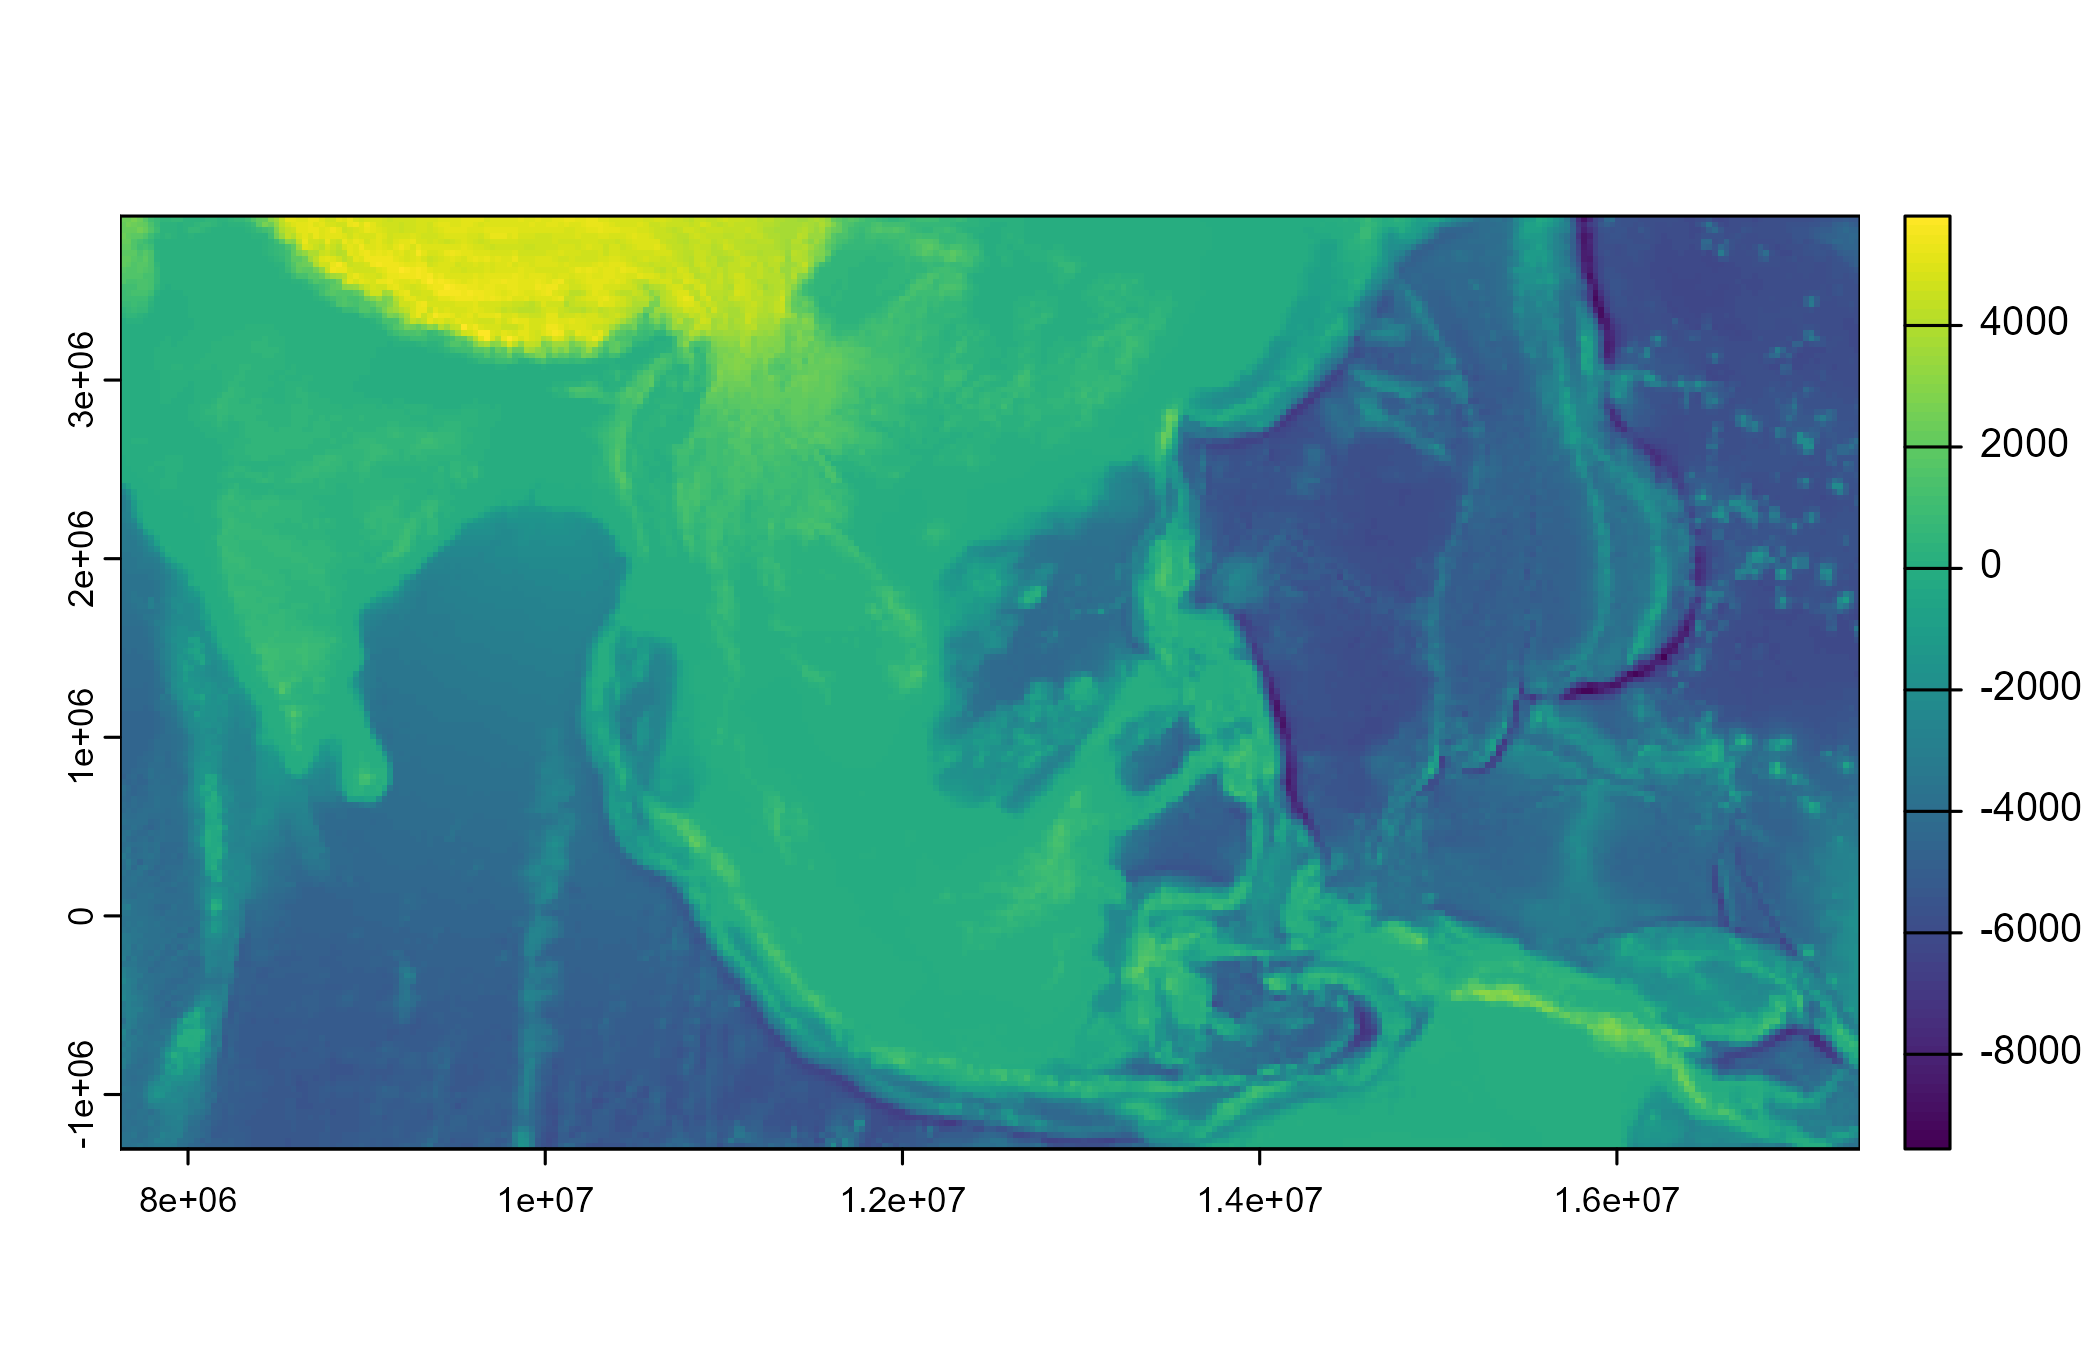
ggplot() +
  geom_spatraster(data = asia) +
  scale_fill_hypso_tint_c(
    palette = "gmt_globe",
    labels = scales::label_number(),
    breaks = c(-10000, -5000, 0, 2500, 5000, 8000),
    guide = guide_colorbar(
      direction = "horizontal",
      title.position = "top",
      barwidth = 20
    )
  ) +
  labs(
    fill = "elevation (m)",
    title = "Hypsometric map of Asia"
  ) +
  theme_minimal() +
  theme(legend.position = "bottom")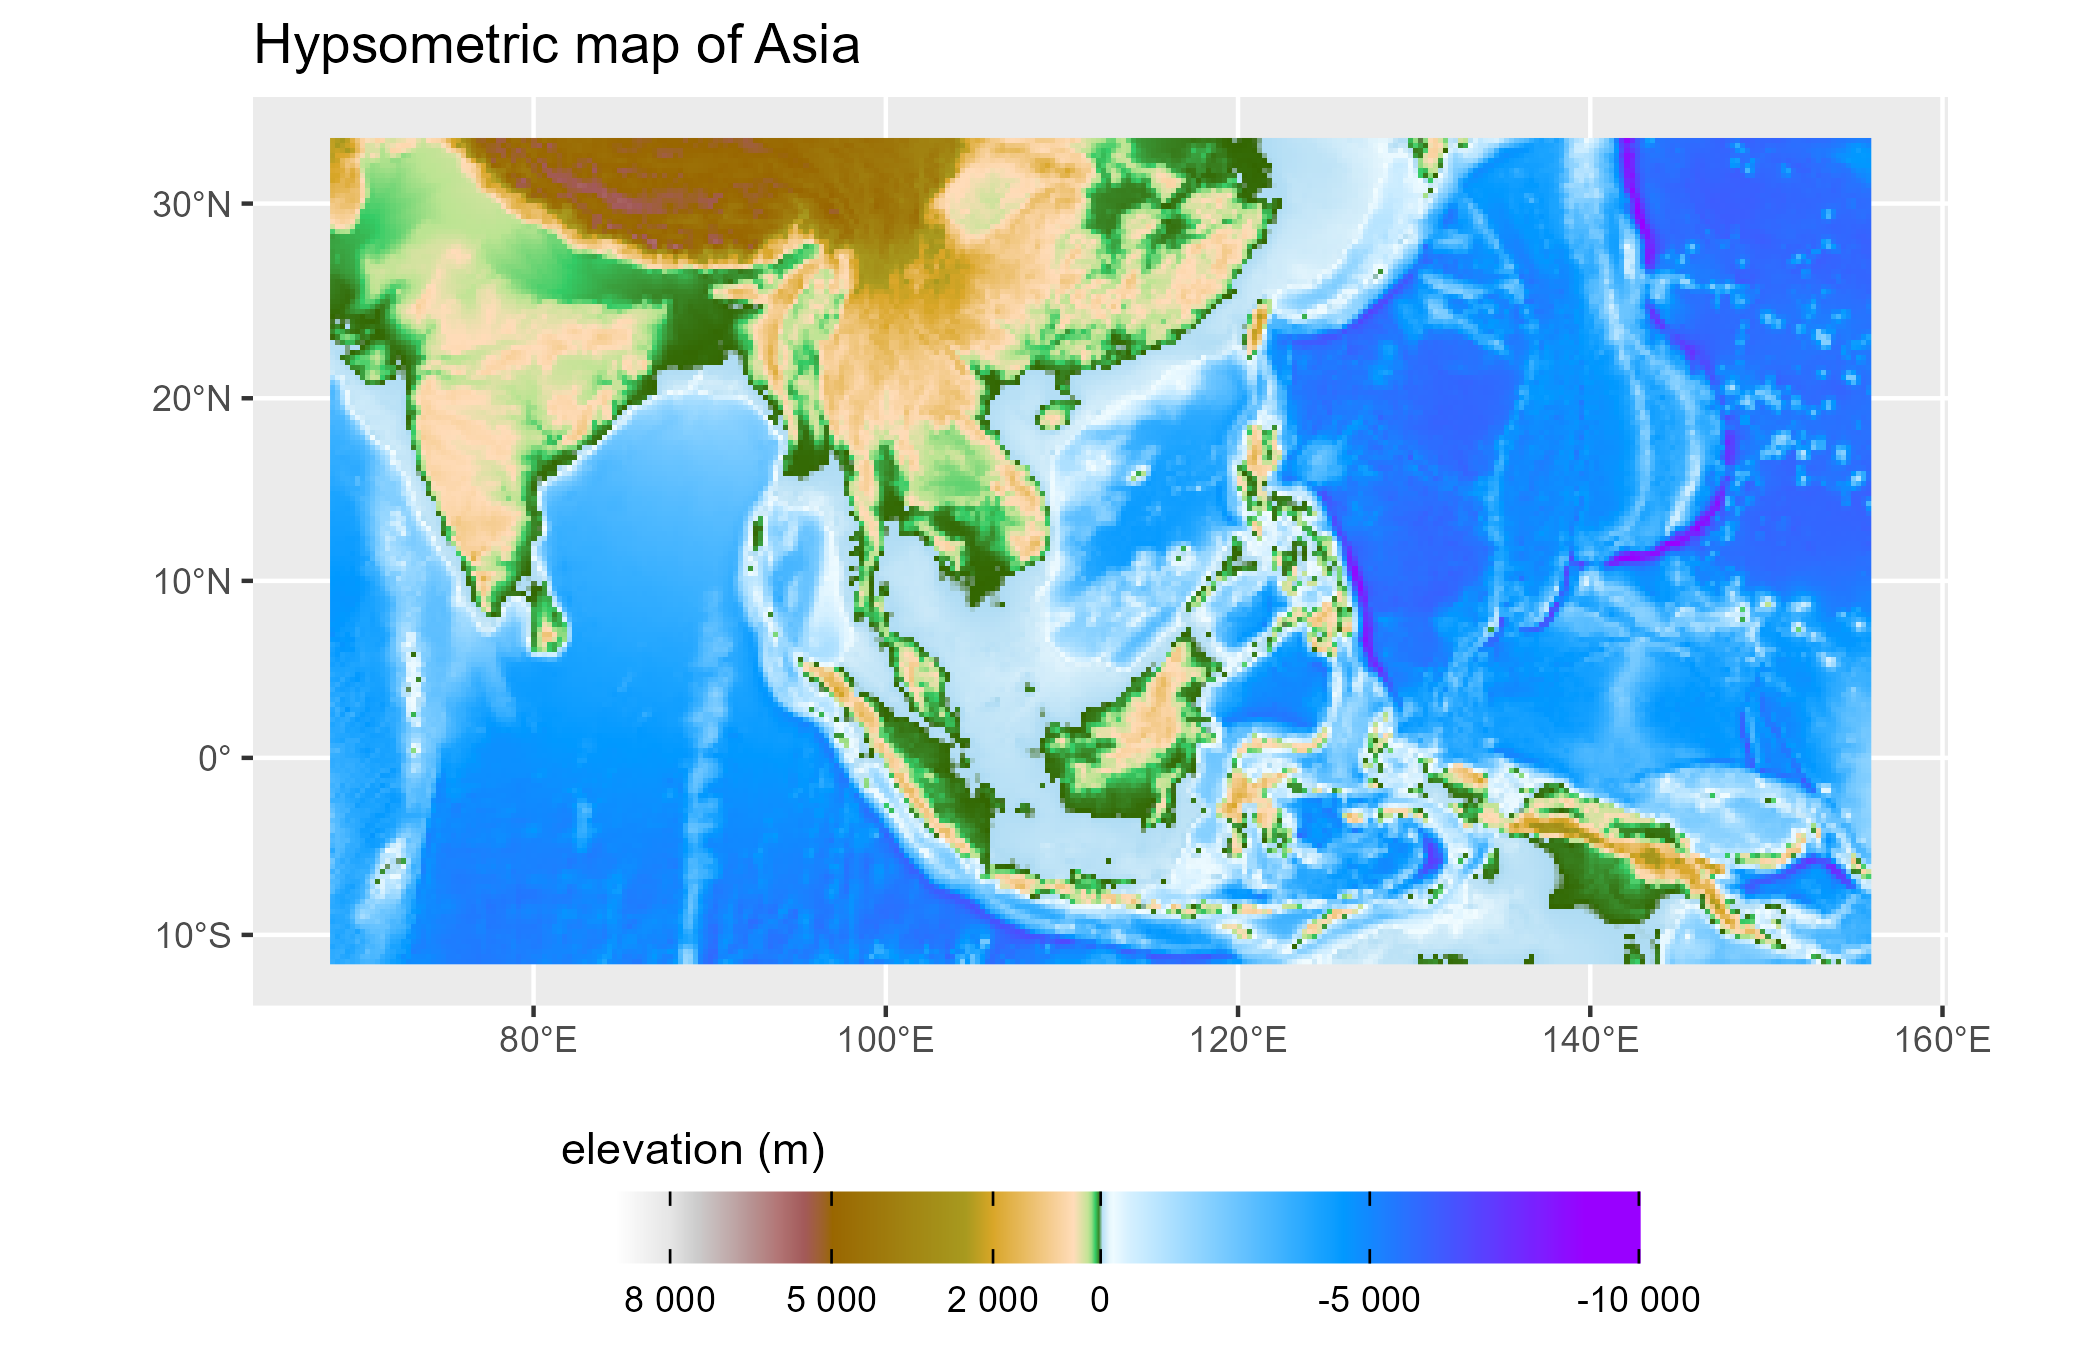
{tidyterra} is currently on development mode. Please leave your feedback or open an issue on https://github.com/dieghernan/tidyterra/issues.
To cite ‘tidyterra’ in publications use:
Hernangomez D (2022). tidyterra: tidyverse Methods and ggplot2 Utils for terra Objects. https://doi.org/10.5281/zenodo.6572471, https://dieghernan.github.io/tidyterra/
A BibTeX entry for LaTeX users is
@Manual{R-tidyterra,
  title = {{tidyterra}: tidyverse Methods and ggplot2 Utils for terra Objects},
  doi = {10.5281/zenodo.6572471},
  author = {Diego Hernangómez},
  year = {2022},
  version = {0.2.0},
  url = {https://dieghernan.github.io/tidyterra/},
  abstract = {Extension of the tidyverse for SpatRaster and SpatVector objects of the terra package. It includes also new geom_ functions that provide a convenient way of visualizing terra objects with ggplot2.},
}{tidyterra} ggplot2 geoms are based on {ggspatial} implementation, by Dewey Dunnington and ggspatial contributors.