

Enabling elements of the University of Konstanz’s corporate design in R.
The unikn package provides color functions — by defining dedicated colors and color palettes, and commands for changing, viewing, and using them — and styled text elements (e.g., for marking, underlining, or plotting colored titles). The pre-defined range of colors and text functions is based on the corporate design of the University of Konstanz (see this link for details), but can be adapted and extended for other institutions and purposes.
Institutions devise corporate design (CD) manuals for creating and maintaining a consistent impression in presentations and publications. In 2014, the University of Konstanz introduced a highly recognizable corporate design. Its key component is the ubiquitous use of a Seeblau color and a corresponding color palette that blends various shades of Seeblau (in boxes, lines, and other graphical elements) with text (in black-and-white). (See the corporate design pages and the Corporate Design Manual (pdf) for details.)
The unikn package facilitates the use of corporate design elements for users of R. While this renders the correct use of default specifications simple and straightforward, we leave some flexibility for experienced users (e.g., for creating scientific visualizations).
The unikn package currently provides five types of objects and functions:
seecol() and usecol());newpal() and grepal());Additional elements may be added as they become available. Please use responsibly!
The latest release of unikn is available from CRAN at https://CRAN.R-project.org/package=unikn:
install.packages('unikn')  # install from CRAN client
library('unikn')           # loads the package
The current development version can be installed from its GitHub repository at https://github.com/hneth/unikn/:
# install.packages('devtools')  # (if not installed yet)
devtools::install_github('hneth/unikn')
library('unikn') # loads the packageA distinctive and recognizable color scheme is the most recognizable element of the University of Konstanz’s corporate design.
Basic color palettes are specified according to the Corporate Design Manual (pdf):
The default color palette pal_unikn combines:
pal_seeblau (reversed, i.e., from darker to lighter);"white" (as the center color);pal_grau[1:4]);"black" (as the last color).This yields a diverging, symmetrical default color palette pal_unikn consisting of 11 colors:
# Default color palette: -----
# pal_unikn  # 11 default colors

# View color palette (by plotting it): -----
seecol(pal_unikn)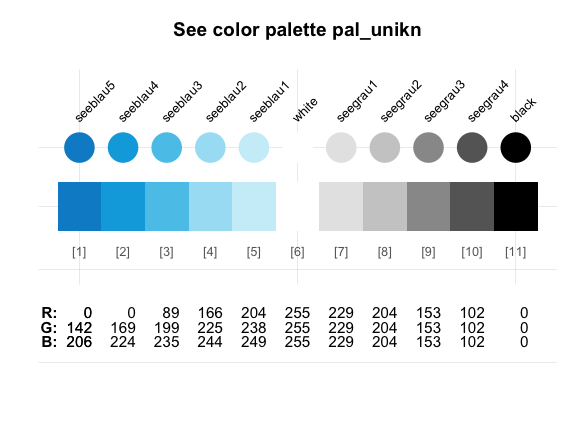
A shorter version consisting of 10 colors is provided as pal_unikn_web.
An alternative color palette with 10 more muted colors (intended for PowerPoint presentations) is provided as pal_unikn_ppt.
Evaluating seecol(pal = "unikn_basic") shows these three basic unikn color palettes.
Beyond the three variants of pal_unikn, the unikn package provides the following color palettes:
seecol("all")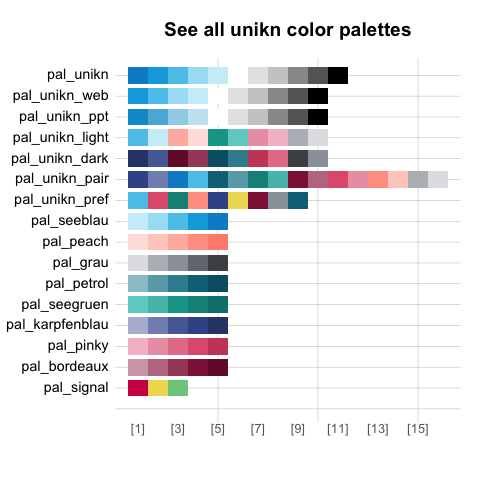
Specifically, an Excel file called Colours for complex graphics defines 9 additional color palettes that are exported by unikn as the following named color palettes:
# Show 9 color gradient palettes:
seecol(pal = "grad_all")
For details, evaluate or apply seecol() on the following color palettes:
# 8 mono-tone palettes: -----
# Name:          Nr:           Tone:
pal_seeblau      # 5 shades of seeblau
pal_peach        # 5           peach
pal_grau         # 5           grau
pal_petrol       # 5           petrol
pal_seegruen     # 5           seegruen
pal_karpfenblau  # 5           karpfenblau
pal_pinky        # 5           pink
pal_Bordeaux     # 5           Bordeaux

# 1 signal (Ampel) palette: -----
pal_signal       # 3           signal/Ampel
Each color palette contains a preferred color.[1] All preferred colors are contained in a corresponding color palette pal_unikn_pref:
# Using preferred colors: -----
pal_unikn_pref             # color palette of preferred colors
pal_unikn_pref[1]          # preferred (named) color 1
pal_unikn_pref[[1]]        # color value 1: #59C7EB"
pal_unikn_pref["Seeblau"]  # preferred color by name
Additional pre-defined color palettes include:
# Plot additional color palettes: -----
seecol(pal_unikn_pref)   # palette of  9 preferred colors
seecol(pal_unikn_light)  # palette of  8 light colors (in 4 pairs)
seecol(pal_unikn_dark)   # palette of  8 dark colors (in 4 pairs)
seecol(pal_unikn_pair)   # palette of 16 paired colors (in 8 pairs)
More flexible and complex color palettes can be created by using the seecol() and usecol() functions.
Two main functions seecol() and usecol() provide a convenient interface for viewing and using color palettes.
Two additional functions newpal() and grepal() serve in auxiliary roles (by allowing to create new color palettes and finding colors whose names match some pattern).
seecol()The seecol() function enables a quick inspection of a color palette. It provides a quick overview over the details of a color palette and allows comparisons between multiple color palettes:
# Plot a color palette: -----
seecol(pal = pal_unikn_pref,            # palette to plot
       col_brd = "white", lwd_brd = 5)  # color and width of borders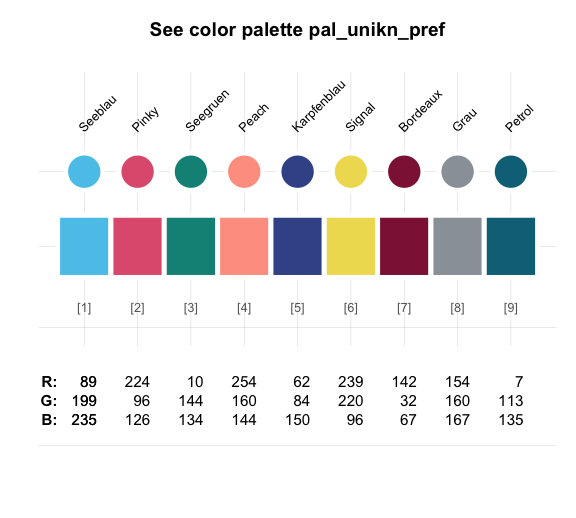
When only a subset of a color palette are needed, the seecol() and usecol() functions provide a reasonable subset of a known unikn color palette:
# All color palettes: -----
seecol(n = 4)
# Only pal_seeblau: -----
# seecol(pal_seeblau, n = 4)The usecol and seecol functions provide some generic options for manipulating and showing color gradients based on given colors or color palettes. This serves 2 main functions:
Here are some examples of these functions in action:
seecol(pal_unikn, n = 21) 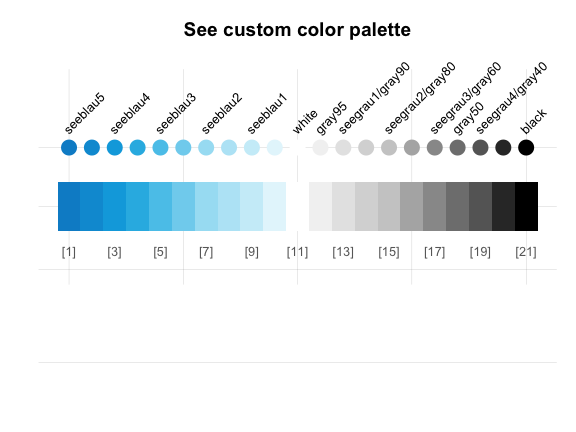
# seecol(pal_seeblau, n = 8) # provides a subset of "good" colorsNote that reducing an unikn color palette selects a suitable subset of its colors, rather than just truncating the scale.
# Combining color palettes (and colors): -----
seecol(c(rev(pal_petrol),  "white", pal_bordeaux), 11,
       col_bg = "grey90")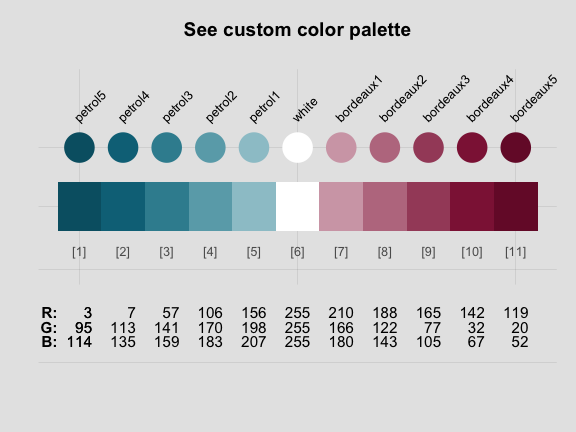
# Related combinations:
seecol(c(rev(pal_seeblau), "white", pal_pinky), 11)
seecol(c(rev(pal_seeblau), "white", pal_seegruen), 11)
seecol(c(rev(pal_seeblau), "white", pal_peach), 11)usecol()The unikn package exports the color palettes shown by seecol(pal = "all") and the nine preferred colors of pal_unikn_pref (e.g., Seeblau, Seegruen, etc.) as named colors.
The usecol() function provides convenient access and additional options for using them in graphs. Here are some examples:
By default, simply set the color argument of a plot to usecol() with some unikn color palette:
# (a) Using a color palette:
barplot(1/sqrt(1:11),  col = usecol(pal_unikn))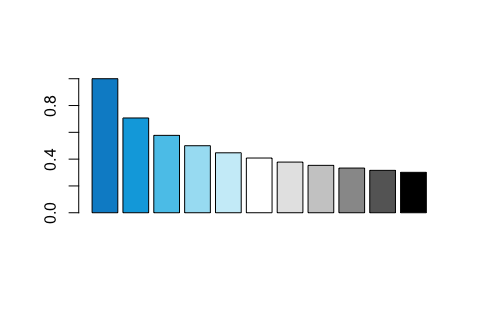
Two additional arguments allow modifying the existing color palette:
providing a value for n reduces or extends the selected color palette;
adding an opacity value for alpha (in the range [0, 1]) regulates color transparency.
image() from graphics):# Random images:
set.seed(1)
n <- 20
m <- matrix(rnorm(n*n), ncol = n, nrow = n)
# image(m, col = seecol(pal_seeblau)) # seecol() shows & use colors
# image(m, col = usecol(pal_peach)) # usecol() only uses colors
# image(m, col = usecol(pal_seegruen))
# image(m, col = usecol(pal_petrol))
image(m, col = usecol(pal_seeblau, n = 50),
main = "50 shades of Seeblau", axes = FALSE)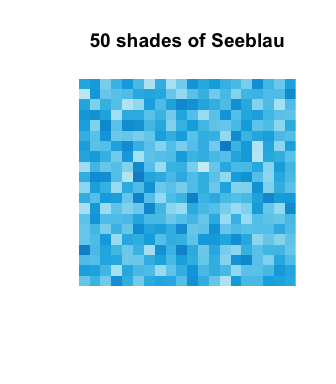
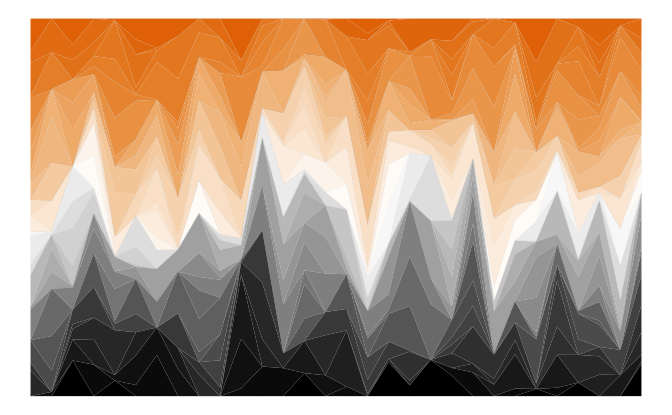
ggplot() commands (using ggplot2):# 0. Create data: ----
# Example based on https://www.r-graph-gallery.com/137-spring-shapes-data-art/
n <- 50
names <- paste("G_", seq(1, n), sep = "")
df <- data.frame()
set.seed(3)
for(i in seq(1:30)){
data = data.frame(matrix(0, n, 3))
data[, 1] <- i
data[, 2] <- sample(names, nrow(data))
data[, 3] <- prop.table(sample( c(rep(0, 100), c(1:n)), nrow(data)))
df = rbind(df, data)}
colnames(df) <- c("X","group","Y")
df <- df[order(df$X, df$group) , ]
# 1. Choose colors: ----
# (a) using RColorBrewer:
library(RColorBrewer)
cur_col <- brewer.pal(11, "Paired")
cur_col <- colorRampPalette(cur_col)(n)
cur_col <- cur_col[sample(c(1:length(cur_col)), size = length(cur_col))] # randomize
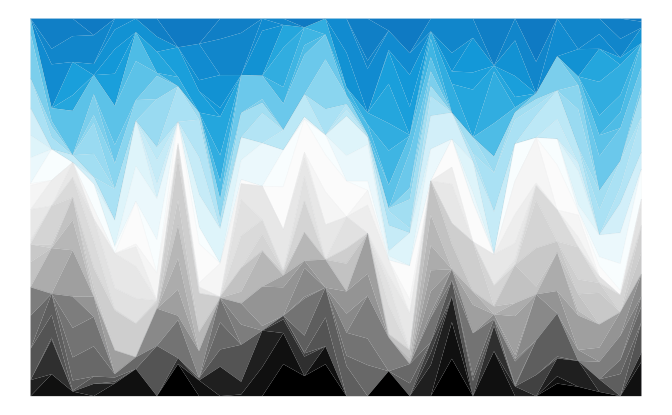
# (b) using unikn:
library(unikn)
cur_col <- usecol(pal = pal_unikn, n = n)
# cur_col <- cur_col[sample(c(1:length(cur_col)), size = length(cur_col))] # randomize
# 2. Plotting: ----
library(ggplot2)
ggplot(df, aes(x = X, y = Y, fill = group)) +
geom_area(alpha = 1, color = Grau, size = .01 ) +
theme_bw() +
scale_fill_manual(values = cur_col) +
theme_void() +
theme(legend.position = "none")
newpal()The newpal() function allows creating new color palettes (typically as data frames with dedicated color names).
The color palettes included in the unikn package are based on the CD manual of the University of Konstanz, Germany. However, the functionality provided by the package makes it easy and straightforward to define and use your own color scales. In the following, we provide examples to illustrate how this can be achieved for other corporations or institutions.
![]()
The color scheme of Princeton University is easily recognized by its combination of orange with black and white elements. The official guidelines (available here) define “Princeton Orange” as Pantone (PMS) 158 C.
The PANTONE™ color finder at https://www.pantone.com/color-finder/158-C yields the following color values:
232 119 34#E877220 62 95 0However, the guide also specifies and distinguishes between two additional versions of orange and provides the following HEX/HTML values for them:
These definitions suggest defining three separate versions of orange and corresponding color palettes:
# HEX values for 3 shades of orange:
orange_basic <- "#E87722"  # Pantone 158 C
orange_white <- "#E77500"  # orange on white
orange_black <- "#F58025"  # orange on black

# Defining color palettes:
pal_princeton <- c(orange_basic, "black")
names(pal_princeton) <- c("orange", "black")

pal_princeton_1 <- c(orange_white, "white", "black")
names(pal_princeton_1) <- c("orange_w", "white", "black")

pal_princeton_2 <- c(pal = c(orange_black, "black", "white"))
names(pal_princeton_2) <- c("orange_b", "black", "white")
Alternatively, we can define both (colors and names) in 1 step by using the newpal() function:
pal_princeton_1 <- newpal(col = c("#E77500", "white", "black"),
                          names = c("orange_w", "white", "black")
                          )
# seecol(pal_princeton_1)
The new color palettes (e.g., pal_princeton_1) can now be viewed with seecol(), scaled by usecol(), and used in graphs (e.g., in ggplot commands):
# View color palette:
# seecol(pal_princeton_1)

# Scale color palette (using df and n from above):
my_pal <- usecol(pal = pal_princeton_1, n = n)

# Use my_pal for plotting:
ggplot(df, aes(x = X, y = Y, fill = group)) +
  geom_area(alpha = 1, color = Grau, size = .01 ) +
  theme_bw() +
  scale_fill_manual(values = my_pal) +
  theme_void() +
  theme(legend.position = "none")
Color palettes for other entities and purposes can easily be created. To illustrate the steps involved, let’s create a color palette of the well-known Google logo.
The typical steps of creating a new palette are:
Choose some colors (and their R color names, or as RGB/HEX/HCL values, e.g., from sites like https://www.schemecolor.com).
Define the colors as an R vector (of type character).
Define their names as a second R vector (of type character).
Use the newpal() command to define the new color palette.
Use the seepal() command to inspect the new color palette.
# 1. Choose colors:
# Google logo colors (from <https://www.schemecolor.com/google-logo-colors.php>)

# 2. Define colors (as vector):
color_google <- c("#4285f4", "#34a853", "#fbbc05", "#ea4335")

# 3. Define color names (as vector):
names_google <- c("blueberry", "sea green", "selective yellow", "cinnabar")

# 4. Define color palette:
pal_google <- newpal(color_google, names_google)

# 5. Inspect color palette:
seecol(pal_google,
       col_brd = "white", lwd_brd = 8,
       title = "Colors of the Google logo")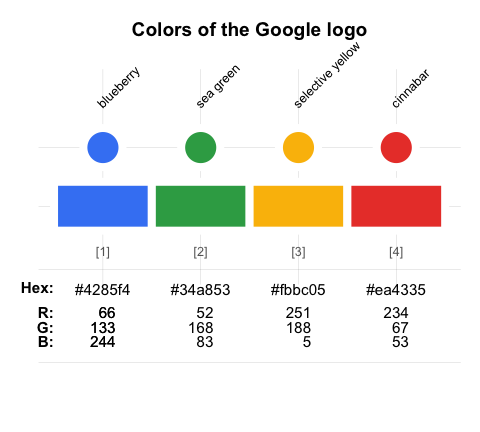
The new palette pal_google can now be used in R graphics and modified in various ways (e.g., by the usecol() function).
See the vignette on “Institutional colors” of the unikn package for additional examples.
grepal()The grepal() function allows finding colors in a color palettes by matching their name to a pattern.
Specifically, grepal(pattern, x) searches a color palette x (i.e., a vector of color names or data frame of named colors) for elements that match a pattern and returns those elements (colors) that match the pattern. The pattern can be a regular expression.
By default, grepal() searches the 657 named colors provided by colors() in base R:
# Find colors matching a pattern:
oranges <- grepal("orange")

# See color palette:
seecol(oranges,
       col_brd = "white", lwd_brd = 2,
       title = "Shades of 'orange' in colors()")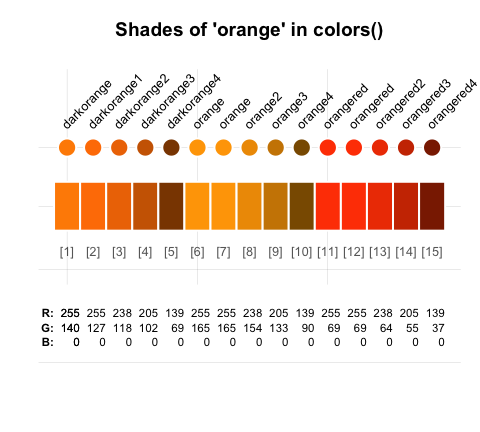
Providing a list of color palettes to the pal argument of the seecol() function allows comparing multiple color palettes:
# Find colors:
pink_olive <- grepal("(pink)|(olive)")
purple_orange <- grepal("(purple)|(orange)")

# See color palettes:
seecol(pal = list(pink_olive, purple_orange),
       pal_names = c("pink|olive", "purple|orange"),
       title = "Comparing pink olives and purple oranges")
To make grepal() more powerful, its pattern argument can use regular expressions, and its x argument works with both vectors and data frames (e.g., the unikn color palettes).
Beyond color functions, unikn also provides some functions for plotting graphical elements (like boxes) and styled text (with decorations like colored backgrounds or underlining). By default, the text-decoration functions assume that you want to add styled text to an existing plot, unless the new_plot argument specifies a type of plot to be generated. As the use of these functions is explained in detail in vignette("Text"), we only provide some examples here:
The mark() function allows emphasizing text by plotting it with colored background (to provide the functionality of “Markieren”):
mark(labels = c("Markieren", "ist ein Bestandteil", "von Studieren."),
     x = 0, y = .8, y_layout = .03, cex = 1.5, new_plot = "slide")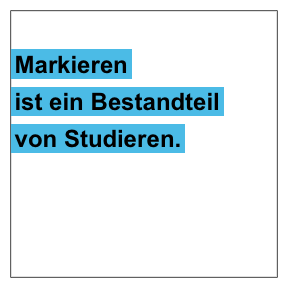
The uline() function allows emphasizing text by plotting it with colored underlining (to provide the functionality of “Unterstreichen”):
uline(labels = c("Geradlinig", "Authentisch", "Beweglich", "Offen", "Paradiesisch"),
      x = .05, y = .9, y_layout = "even", cex = 1.1, font = 2, new_plot = "slide")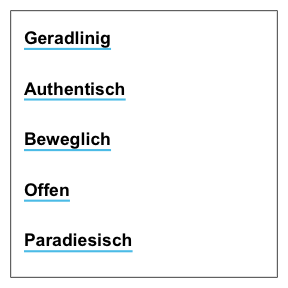
The post() function allows adding text to a rectangular xbox (to provide the functionality of “Merken”):
xbox(col = usecol(pal_seeblau[[5]]), dim = c(2, 2))
post(labels = c("Für eine", "Kultur der", "Kreativität"), x = .1, y = .8, cex = 1.4, font = 2)
The color and font parameters can be adjusted to obtain different looks:
post(labels = c("creative.", "together"), new_plot = "xbox",
     y_layout = .02, cex = 2, font = c(1, 3),
     col_bg = pal_seegruen[[1]], col = c(Petrol, Pinky))
The heading() function is a convenient wrapper around mark:
heading(labels = c("pa-", "ra-", "die-", "sisch"))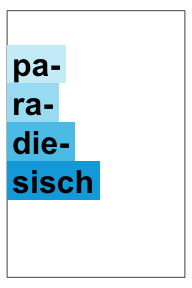
Headings violating the official recommendations (e.g., step-wise titles) will generate a message:
heading(labels = c("Ewig", "währt am", "längsten..."),
        y = 2/3, col_bg = usecol(pal_pinky))
#> Step-wise titles are discouraged: Consider re-arranging?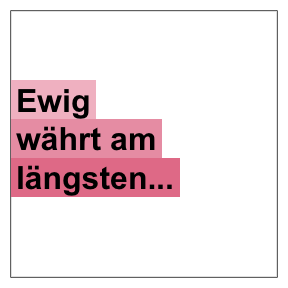
Finally, the url_unikn() function allows formatting URLs the uni.kn way:
my_url <- url_unikn("https://www.uni-konstanz.de/")  # input URL as copied from web browser

post(labels = my_url, x = .2, y = .1, font = 4, new_plot = "xbox")
If custom color palettes are available, the text decoration functions can be used for graphical annotations.

pal_google (defined above):
Please note the following caveats:
Plotting text (i.e., graphically rendering characters) is rarely a good idea. It typically doesn’t scale (when changing the size of images) and cannot be recognized automatically (e.g., copied, indexed, or scraped). Hence, the following functions should only be used in contexts in which no better solutions are available or practical (e.g., when specifically creating images, or needing to add text to graphs).
Like all other templates, our renderings are subject to constraints and limitations. As a standard installation of R lacks the official “Theinhardt” fonts, we can only mimic the design specifications (in Arial, sans serif). Nevertheless, the unikn package helps preventing common mistakes by novices (e.g., boxes or lines extending beyond text, or step-functions in multi-line titles) and can be customized and improved by expert users.
Overall, we hope that the following functions will be useful for plotting graphical elements (e.g., boxes, logos, etc.) and achieving a uniform look when styling visualizations.

The unikn package is work in progress. We are still working on:
Please contact us in case you need additional features or want to help us implementing them.
The following versions of unikn and corresponding resources are currently available:
| Type: | Version: | URL: |
|---|---|---|
| A. unikn (R package): | Release version | https://CRAN.R-project.org/package=unikn |
| Development version | https://github.com/hneth/unikn/ | |
| B. Online documentation: | Release version | https://hneth.github.io/unikn/ |
| Development version | https://hneth.github.io/unikn/dev/ |
Please report any unikn-related issues at https://github.com/hneth/unikn/issues. We appreciate your feedback, comments, or questions.
![]()
The University of Konstanz’s Corporate Design (CD) was created by Strichpunkt GmbH and the University of Konstanz in 2014. The unikn package authors belong to the research group on Social Psychology and Decision Sciences (SPDS) at the University of Konstanz. We make some CD elements available to fellow users of R (e.g., for creating scientific visualizations), but all copyrights remain with the original copyright holders.
We aim for an authentic representation of a highly-specified corporate design. While rigid specifications help to maintain coherence and consistency, they also tend to cause frustration in expert users. As the design has been developed in a flexible way that allows for individual elements to be modified as needed, we allow for some liberties, mostly by relaxing some restrictions. Examples include:
seecol() and usecol() functions to color palettes);Signal color (from pal_signal);

unikn by Hansjörg Neth and Nico Gradwohl is licensed under a Creative Commons Attribution-ShareAlike 4.0 International License. (Based on a work at https://github.com/hneth/unikn).
The copyrights to all designs remain with their original creators:
Universität Konstanz, © 2015, Version 1.6, 21. September 2015, ‒ uni-konstanz.de
Strichpunkt GmbH, ‒ strichpunkt-design.de
Color definitions are based on the specifications at:
(Updated on 2021-03-24.)
[1] Whereas the official definition does not identify a preferred color for the Ampel color palette (pal_signal), we provide its alert color (i.e., pal_signal[2]) as a designated color Signal.