![]()
![]()
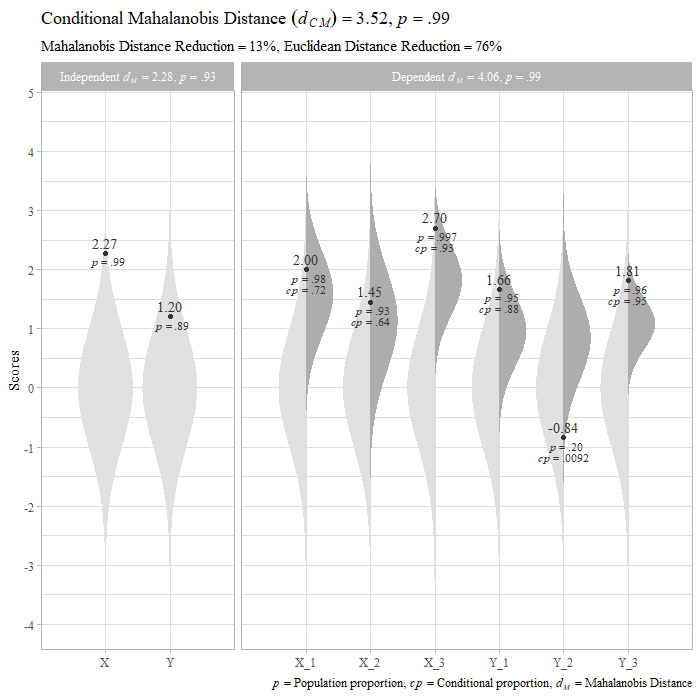
The goal of unusualprofile is to calculate conditional Mahalanobis distances and related statistics. Such statistics can help find cases that are unusual, even after controlling for specified predictors.
You can install the development version from GitHub with:
To use the unusualprofile package, all that is needed is to know the correlations, means, and standard deviations among a set of continuous variables and at least one row of data from that set of variables.
Suppose we have set of variables that have the following relationships:

First, we load the unusualprofile package.
Included with the unusualprofile package, the d_example data set has a single row of data generated from the path diagram depicted above.
#>   X_1 X_2 X_3 Y_1   Y_2 Y_3   X   Y
#> 1   2 1.4 2.7 1.7 -0.84 1.8 2.3 1.2
Also included with the unusualprofile package is the path diagram’s model-implied correlation matrix:
R_example
#>      X_1  X_2  X_3  Y_1  Y_2  Y_3    X    Y
#> X_1 1.00 0.35 0.56 0.34 0.29 0.38 0.70 0.42
#> X_2 0.35 1.00 0.40 0.24 0.21 0.27 0.50 0.30
#> X_3 0.56 0.40 1.00 0.38 0.34 0.43 0.80 0.48
#> Y_1 0.34 0.24 0.38 1.00 0.56 0.72 0.48 0.80
#> Y_2 0.29 0.21 0.34 0.56 1.00 0.63 0.42 0.70
#> Y_3 0.38 0.27 0.43 0.72 0.63 1.00 0.54 0.90
#> X   0.70 0.50 0.80 0.48 0.42 0.54 1.00 0.60
#> Y 0.42 0.30 0.48 0.80 0.70 0.90 0.60 1.00cond_maha functionWe can specify the correlations (R), means (mu), standard deviations (sigma). independent variables (v_ind), and dependent variables (v_dep). In this case, the independent variables are composite scores summarizing the dependent variables.
# Conditional Mahalanobis distance
cm <- cond_maha(data = d_example,
          R = R_example,
          mu = 0,
          sigma = 1,
          v_ind_composites = c("X", "Y"),
          v_dep = c("X_1", "X_2", "X_3",
                    "Y_1", "Y_2", "Y_3"))

cm
#> Conditional Mahalanobis Distance = 3.5167, df = 4, p = 0.9852

# Plot
plot(cm)